EUR/USD Current price: 1.0820
View Live Chart for the EUR/USD
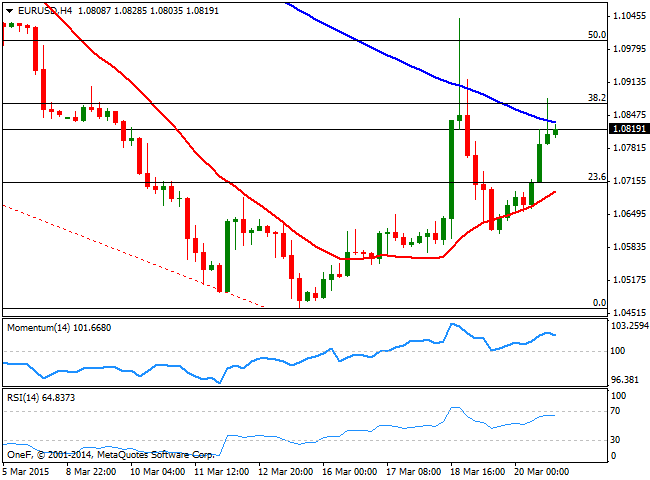
The more dovish than expected FED, resulted in the well needed USD bearish corrective movement that then resulted in a higher EUR/USD: the pair saw a short lived spike up to 1.1041, before closing the week below 1.0865, the 38.2% retracement of the latest bearish rally, measured from 11533, to the record low set this month at 1.0460. Many are speculating the pair has set a low and is due for a stronger upward continuation, but that's quite an early call considering the pair has been in a steady decline for almost a year already, from a top se at 1.3992 in April 2014. Nevertheless, this 350 pips recovery has been the largest upward corrective move in the same time frame, and can extend particularly if the US data continues to miss expectations. During the upcoming days the country will release housing data, CPI figures, Durable Goods Orders and its GDP by Friday, and all of them will make a clearer picture of what's next for the pair.
In the meantime, the intraday picture favors the upside, as the price holds below the mentioned Fibonacci level, tested last Friday, whilst the 20 SMA presents a strong bullish slope below the current price, offering dynamic support around 1.0690. In the same chart, the Momentum indicator turned lower, losing its upward strength, but holding well into positive territory, while the RSI indicator stands flat around 64, all of which should keep the downside limited in the short term.
Support levels: 1.0790 1.0745 1.710
Resistance levels: 1.0865 1.0910 1.0955
EUR/JPY Current price: 129.73
View Live Chart for the EUR/JPY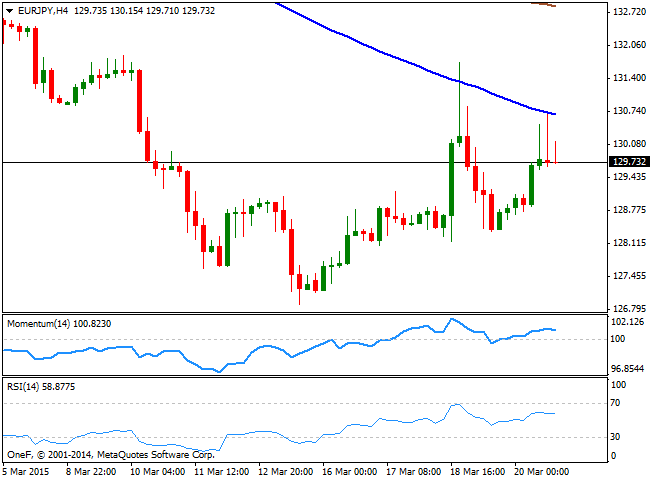
The Japanese yen maintained a mild strength last week, when the main theme was the dollar weakness, preventing the EUR/JPY to rally, despite EUR temporal strength. The pair flirted a couple of times with the 130.00 level, but remains so far below it, finding intraday sellers around a strongly bearish 100 SMA, currently at 130.70 according to the 4 hours chart. In the same time frame, the technical indicators turned lower well into positive territory, lacking bearish signals at the time being. Shorter term, the 1 hour chart shows that the technical indicators retraced from overbought territory as the price retraced from the mentioned high, whilst the 100 SMA crosses above the 200 SMA below the current level, with the shorter acting as support around the 128.80 level.
Support levels: 129.55 129.20 128.80
Resistance levels: 130.10 130.70 131.20
GBP/USD Current price: 1.4931
View Live Chart for the GBP/USD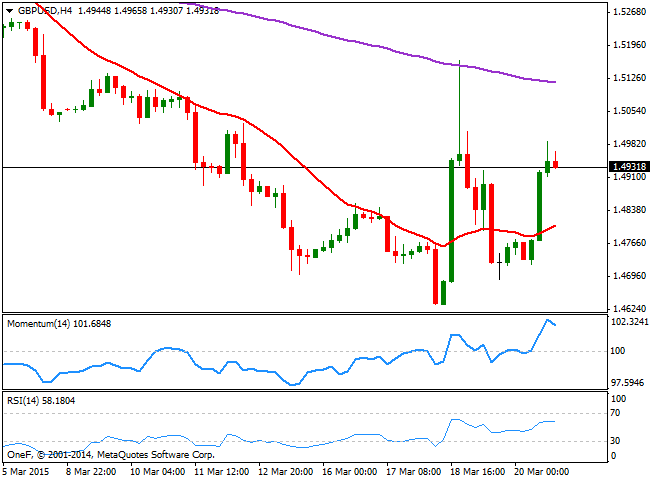
The British Pound also benefited by US Central Bank less optimistic message, surging temporarily up to 1.5164 against the greenback last week. But the GBP/USD pair failed to sustain gains beyond the 1.5000 critical level, still a line in the sand between bullish and bearish strength. Technically, the 1 hour chart shows that the technical indicators are giving signs of upward exhaustion near overbought levels, and are turning lower, whilst the 20 SMA maintains a strong bullish slope well below the current level, at 1.4830. In the 4 hours chart the price develops well above a mild bullish 20 SMA, currently around 1.4810, while the Momentum indicator turned sharply lower from overbought levels and the RSI indicator consolidates around 58, all of which limits chances of a downward acceleration. Nevertheless, an upward acceleration through the 1.5000 figure is required to confirm additional advances, eyeing then a probable test of the 200 EMA in the 4 hours chart at 1.5120.
Support levels: 1.4890 1.4850 1.4810
Resistance levels: 1.4950 1.5000 1.5045
USD/JPY Current price: 120.02
View Live Chart for the USD/JPY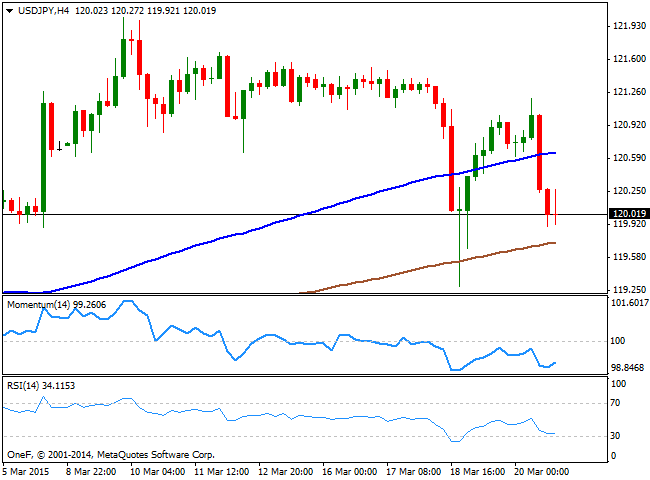
The USD/JPY pair shed ground falling as low as 119.29 before bouncing some, but still struggling to remain above the 120.00 level. During the weekend, BOJ Governor Kuroda once again supported the ongoing QE in the country, although at this point, market has already priced in all of the upcoming easing, which means the effect it may have in the economy is now limited, and the yen can surge, particularly if the dollar bearish corrective movement extends this week. From a technical point of view, the 1hour chart shows that the price was rejected from its moving average, with the 100 and 200 SMAs gaining bearish slopes well above the current level, while the technical indicators maintain their strong bearish slopes and are nearing oversold territory. In the 4 hours chart the technical indicators are aiming slightly higher from oversold levels, but with the price pressuring the lows the risk remains towards the downside, eyeing a retest of last week low should the 120.00 level give up.
Support levels: 120.00 119.60 119.25
Resistance levels: 120.40 120.85 121.30
AUD/USD Current price: 0.7761
View Live Chart for the AUD/USD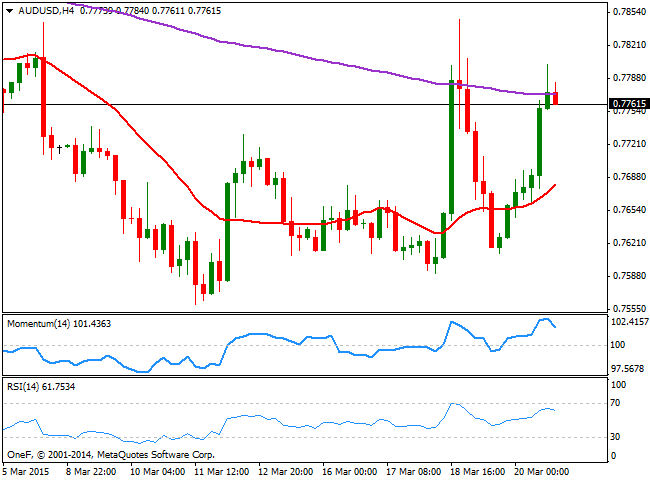
The AUD/USD pair's recovery has been quite shallow compared to other majors, as it held below the 0.7800 by the end of the week, signaling the dominant bearish term remains in place in the long term. From a technical point of view, the 1 hour chart shows that the price holds above a bullish 20 SMA, currently around 0.7710 offering intraday support, whilst the technical indicators have turned lower from overbought territory, with the RSI heading lower around 63, and supporting some further declines. In the 4 hours chart the price faltered around a mild bearish 200 EMA a couple of times last week, despite some spikes above it, still acting as a strong dynamic resistance around the 0.7780 level, whilst the technical indicators are turning lower from overbought levels, lacking bearish strength at the time being. With dollar current weakness, the pair may advance some over the upcoming sessions, but selling higher is still the preferred view in the pair.
Support levels: 0.7740 0.7695 0.7660
Resistance levels: 0.7780 0.7810 0.7840
Recommended Content
Editors’ Picks
AUD/USD risks a deeper drop in the short term

AUD/USD rapidly left behind Wednesday’s decent advance and resumed its downward trend on the back of the intense buying pressure in the greenback, while mixed results from the domestic labour market report failed to lend support to AUD.
EUR/USD leaves the door open to a decline to 1.0600

A decent comeback in the Greenback lured sellers back into the market, motivating EUR/USD to give away the earlier advance to weekly tops around 1.0690 and shift its attention to a potential revisit of the 1.0600 neighbourhood instead.
Gold is closely monitoring geopolitics

Gold trades in positive territory above $2,380 on Thursday. Although the benchmark 10-year US Treasury bond yield holds steady following upbeat US data, XAU/USD continues to stretch higher on growing fears over a deepening conflict in the Middle East.
Bitcoin price shows strength as IMF attests to spread and intensity of BTC transactions ahead of halving

Bitcoin (BTC) price is borderline strong and weak with the brunt of the weakness being felt by altcoins. Regarding strength, it continues to close above the $60,000 threshold for seven weeks in a row.
Is the Biden administration trying to destroy the Dollar?

Confidence in Western financial markets has already been shaken enough by the 20% devaluation of the dollar over the last few years. But now the European Commission wants to hand Ukraine $300 billion seized from Russia.