EUR/USD Current price: 1.10597
View Live Chart for the EUR/USD
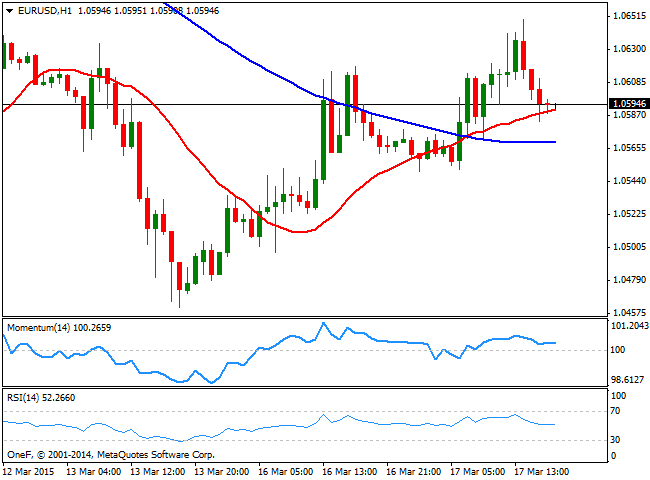
The EUR/USD pair erased all of its intraday gains after posting a fresh weekly high of 1.0650 early in the US session, following worse-than-expected US housing data, showing housing starts plunged in February by 17%. A side from employment data, macroeconomic figures in the US have been quite disappointing this March, although the American dollar has maintained its strength. That's why Wednesday's FOMC Minutes are so relevant because it will shed light on whether the Central Bank will weight this temporal slowdown in its decision of rising rates or not. By contrast, the European data released early Tuesday beat expectations, with improved employment and confidence readings. Anyway, the pair trades right below the 1.0600 figure, and will likely remain range bound ahead of FED's decision next Wednesday afternoon.
From a technical point of view, the 1 hour chart shows that the price holds above a bullish 20 SMA, whilst the 100 SMA stands around the 1.0570 price zone, the first time the price overcomes it since late February. The technical indicators in the mentioned time frame have lost the upward strength, but remain in positive territory, which should keep the downside limited in the short term. In the 4 hours chart the price holds above a flat 20 SMA, currently around 1.0560, whilst the Momentum indicator continues to head higher above 100 and the RSI turned lower around 47, limiting in this case, the upside.
Support levels: 1.0550 1.0510 1.0470
Resistance levels: 1.0650 1.0690 1.0725
EUR/JPY Current price: 128.57
View Live Chart for the EUR/JPY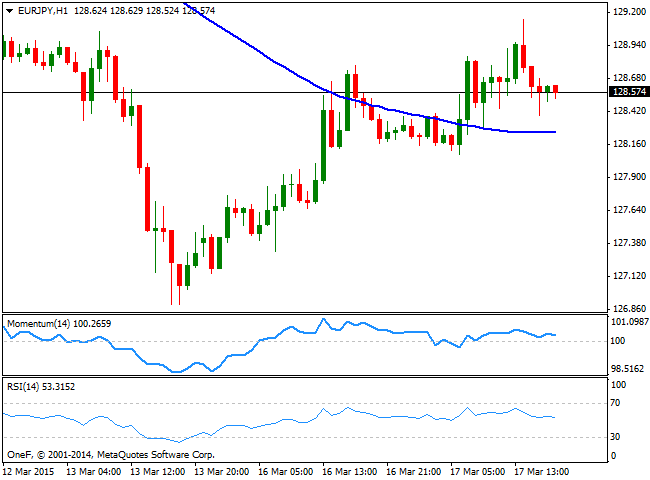
The EUR/JPY ends the day with limited gains, with most of yen's pairs consolidating ahead of big US news. The 1 hour chart shows that the price advanced above its 100 SMA, but was rejected from a daily high of 129.14, whilst the technical indicators hover directionless above their mid-lines. In the 4 hours chart the Momentum indicator heads higher above 100, but the RSI turned lower around 50. Furthermore, the previous candle shows a long upper shadow, which reflects selling EUR crosses at higher levels continue to be consider attractive. A firmer advance above the 129.10/20 area is required to confirm further advances, with a break below 127.50 on the other hand probably signaling a continued decline post-FOMC.
Support levels: 128.20 127.50 126.90
Resistance levels: 128.65 129.10 129.50
GBP/USD Current price: 1.4761
View Live Chart for the GBP/USD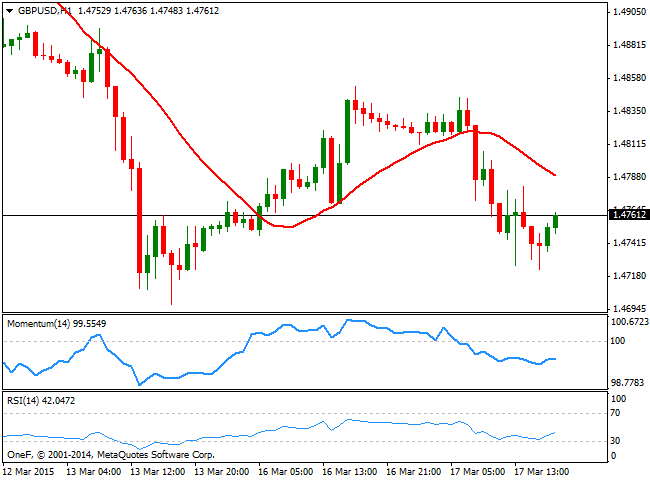
The GBP/USD pair erased all of its early week gains, falling down to 1.4723, weighed by EUR/GBP demand. The lack of fundamental data in the UK will come to an end this Wednesday, with the release of local employment figures and the Bank of England Minutes, expected to anticipate the Central Bank will keep a dovish tone, and delay a possible rate hike for next year. The pair has managed to post a limited bounce from the mentioned daily low, but the short term picture supports some additional declines, as the 1 hour chart shows that the price holds below a bearish 20 SMA, whilst the Momentum indicator heads lower below 100 and the RSI indicator consolidates around 40. In the 4 hours chart the 20 SMA continues to limit the upside, currently at 1.4790, albeit the Momentum indicator is crossing its mid-line to the upside while the RSI bounces from oversold levels, suggesting the recovery may extend, particularly if the price advances above the mentioned 1.4790 dynamic resistance level.
Support levels: 1.4740 1.4700 1.4660
Resistance levels: 1.4790 1.4820 1.4860
USD/JPY Current price: 121.32
View Live Chart for the USD/JPY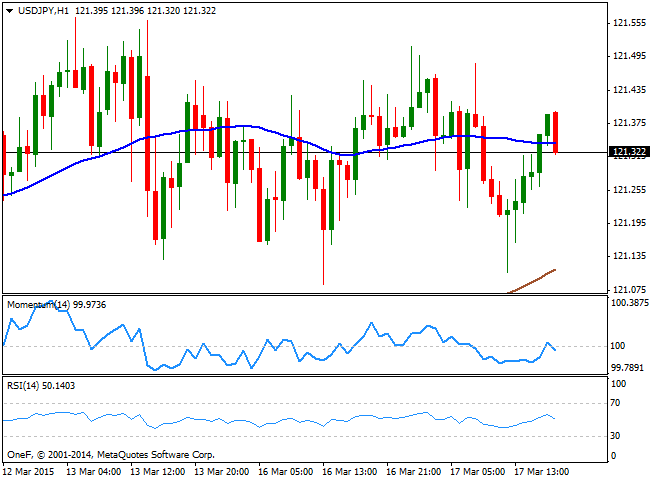
The USD/JPY pair has traded in quite a limited range this Tuesday, recovering from an early deep down to 121.10, reached after Japanese deficit fell beyond expected to ¥-1,050.0B in February. Nevertheless, the pair remained confined to a 40 pips range, and the 1 hour chart shows that the price is stuck around a horizontal 100 SMA, while the technical indicators remain in neutral territory. In the 4 hours chart, the price develops well above its moving averages, but the technical indicators are also hovering around their mid-lines, giving no clues on what's next for the pair. The range will likely persists until the FED unveils its latest decision, with the 122.00 level as a probable immediate bullish target if the Central Bank removes the word "patient" from its statement.
Support levels: 121.05 120.65 120.30
Resistance levels: 121.50 121.95 122.40
AUD/USD Current price: 0.7621
View Live Chart for the AUD/USD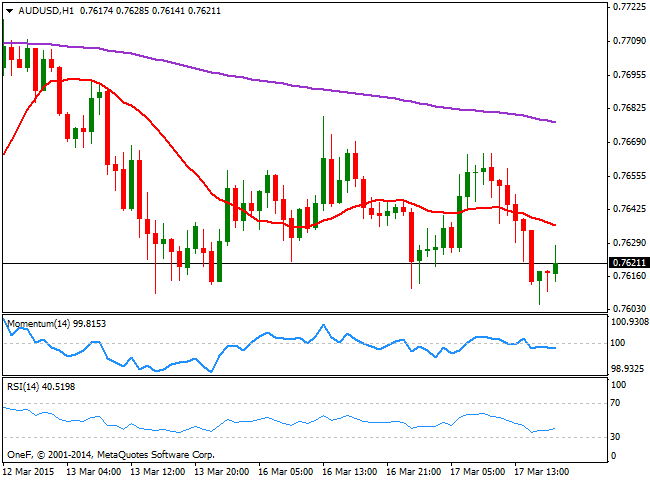
The Australian dollar edged lower against its American rival, weighed by local disappointing factory data and a foreseeable RBA. The Central Bank released the Minutes of its latest meeting during the past Asian session, adding nothing new to what market already knows. The AUD/USD pair failed to extend gains beyond the 0.7660 level, the daily high posted during Asian hours, but found some short term buying interest at 0.7605 the daily low. Technically, the 1 hour chart presents a neutral-to-bearish technical stance, as the price develops below its 20 SMA, whilst the technical indicators stand below their mid-lines, showing no directional strength. In the 4 hours chart the 20 SMA presents a tepid bearish slope above the current price, whilst the indicators aim higher below their mid-lines, also lacking strength at the time being. An intraday recovery will likely find selling interest in the 0.7590/0.7735 region, as the long term bearish trend remains intact and will prevail regardless the US Federal Reserve decision.
Support levels: 0.7605 0.7575 0.7530
Resistance levels: 0.7660 0.7690 0.7735
Recommended Content
Editors’ Picks
EUR/USD stays below 1.0700 ahead of US data

EUR/USD stays in a consolidation phase slightly below 1.0700 in the European session on Wednesday. Upbeat IFO sentiment data from Germany helps the Euro hold its ground as market focus shifts to US Durable Goods Orders data.
USD/JPY refreshes 34-year high, attacks 155.00 as intervention risks loom

USD/JPY is renewing a multi-decade high, closing in on 155.00. Traders turn cautious on heightened risks of Japan's FX intervention. Broad US Dollar rebound aids the upside in the major. US Durable Goods data are next on tap.
Gold manages to hold above $2,300

Gold struggles to stage a rebound following Monday's sharp decline but manages to hold above $2,300. The benchmark 10-year US Treasury bond yield stays in the green above 4.6% ahead of US data, not allowing XAU/USD to gain traction.
Worldcoin looks set for comeback despite Nvidia’s 22% crash Premium

Worldcoin price is in a better position than last week's and shows signs of a potential comeback. This development occurs amid the sharp decline in the valuation of the popular GPU manufacturer Nvidia.
Three fundamentals for the week: US GDP, BoJ and the Fed's favorite inflation gauge stand out Premium

While it is hard to predict when geopolitical news erupts, the level of tension is lower – allowing for key data to have its say. This week's US figures are set to shape the Federal Reserve's decision next week – and the Bank of Japan may struggle to halt the Yen's deterioration.