EUR/USD Current price: 1.1071
View Live Chart for the EUR/USD
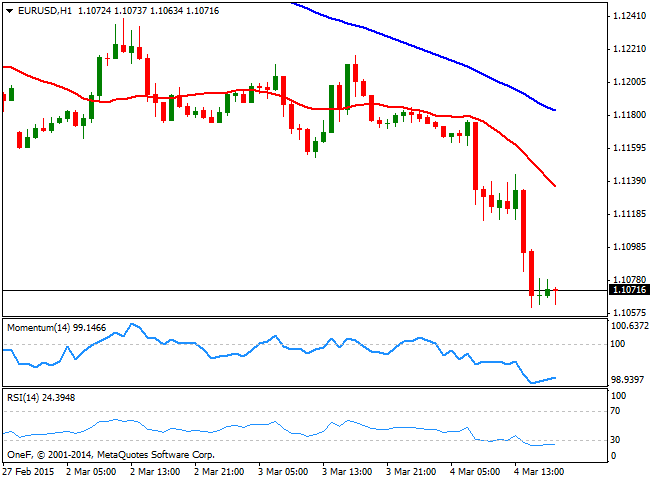
The EUR/USD pair sunk to levels not seen since September 2009, reaching a daily low of 1.1061 before halting the slide. The pair has been under pressure ever since early in the European session, triggering stops before the release of the European Markit Services PMIs, all of which missed expectations, fueling the decline in the common currency. The EZ Retail Sales resulted up beating, soaring 1.1% in January, whilst in the US, the ADP private survey anticipated the country may have created around 212K new jobs last month, slightly below the 220K expected. But the dollar strength, and the overall markets' behavior, had little to do with fundamentals this Wednesday, and all about upcoming ECB meeting and the release of details about the QE program the area will launch this month. Stocks retreated across the world after flirting with record highs during the lasts sessions, as investors locked profits ahead of the critical event.
Anyway and from a technical point of view, the 1 hour chart for the pair shows that the price accelerated further below its 20 SMA, whilst the Momentum indicator hovers deep in negative territory and the RSI heads lower at extreme oversold levels, currently at 23. In the 4 hours chart the Momentum indicator presents a sharp bearish slope below 100 whilst the 20 SMA caps the upside around 1.1160, should the price regain the upside, whilst the RSI also stands in oversold territory. Despite the extreme readings, the price consolidates below the 1.1100 figure, which reflects the strong selling interest around the pair.
Support levels: 1.1095 1.1050 1.1010
Resistance levels: 1.1150 1.1180 1.1230
EUR/JPY Current price: 132.53
View Live Chart for the EUR/JPY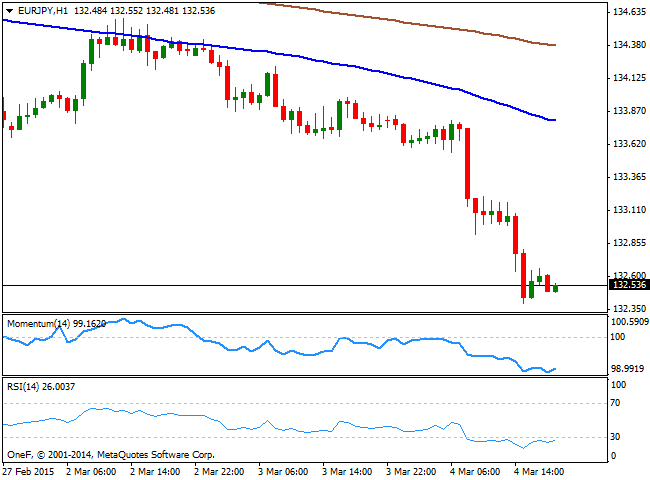
The Japanese yen strengthened against most of its rivals, as demand for safe-haven assets got a boost from falling equities. There will be no relevant in Japan during the upcoming session, which means the currency will continue to be subject of sentiment trading. The EUR/JPY was heavily weighed by the EUR weakness, and trades at a fresh 4-week low having been as low as 132.40 in the day. From a technical point of view, the bearish momentum seems exhausted in the short term, as the price stands well below its 100 and 200 SMAs, while the indicators aim slightly higher still in extreme oversold territory. In the 4 hours chart the pair consolidates near its daily lows, with the price well below its moving averages and the Momentum indicator heading lower below 100, supporting some further declines. The RSI indicator in this last time frame stands flat at 26, all of which supports a downward continuation particularly if the daily low gives up.
Support levels: 132.40 131.90 131.50
Resistance levels: 132.85 133.25 133.70
GBP/USD Current price: 1.5265
View Live Chart for the GBP/USD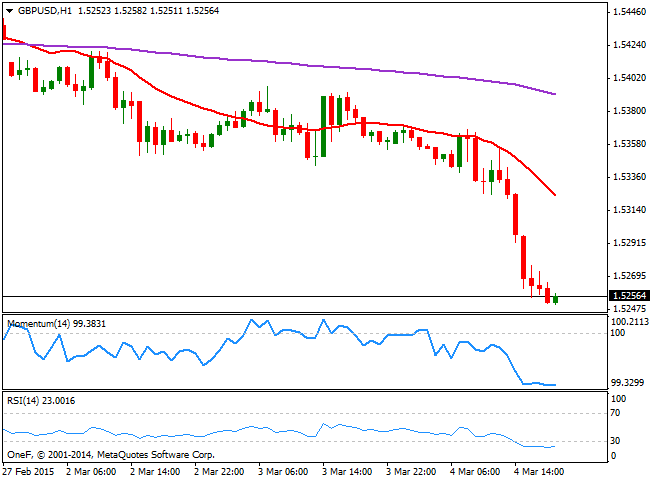
The GBP/USD pair fell down to 1.5258, a fresh 3-week low, weighed by dollar momentum, and slightly weaker than expected Markit Services PMI in the UK. The services' sector in the United Kingdom eased to 56.7 in February, from a previous reading of 57.2 and an expected 57.5. Nevertheless, a sub-component of the report showed that wages grew in the UK, which if its continues to be sustainable, will end up being a positive long term support for the Pound. Technically and in the short term, the downside is still favored, as the 1 hour chart shows that the price consolidates near the daily low, with the 20 SMA maintaining a strong bearish slope well above the current price, and the technical indicators losing their bearish strength in overbought territory, although far from suggesting an upward correction. In the 4 hours chart, the price accelerated below the 200 EMA, breaking below the critical level for the first time since early February. In the same time frame, the technical indicators maintain their bearish slopes well into negative territory, supporting a downward continuation if the 1.5250 static support level, gives up.
Support levels: 1.5250 1.5220 1.5180
Resistance levels: 1.590 1.5330 1.5365
USD/JPY Current price: 119.71
View Live Chart for the USD/JPY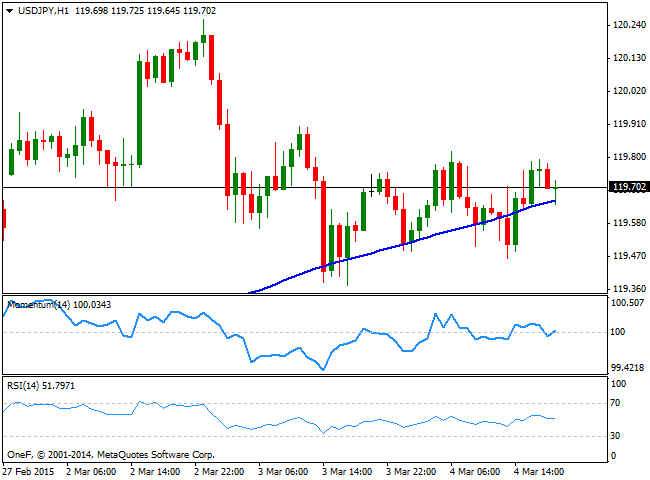
The USD/JPY pair has extended its consolidative phase, trading below the 120.00 figure, and finding short term buying interest around 119.40. The 1 hour chart shows that the price fell briefly below a bullish 100 SMA, before recovering, now finding some intraday support around it, whilst the technical indicators hover directionless around their mid-lines. In the 4 hours chart the latest candles show long shadows both sides of the board and thin bodies, reflecting the lack of directional strength, whilst the indicators hold in neutral territory. The pair will likely remain range bound until Friday, when the US will release its monthly employment figure, and if something, the reaction to ECB decision will likely remain limited.
Support levels: 119.40 119.10 118.80
Resistance levels: 119.95 120.45 120.90
AUD/USD Current price: 0.7812
View Live Chart for the AUD/USD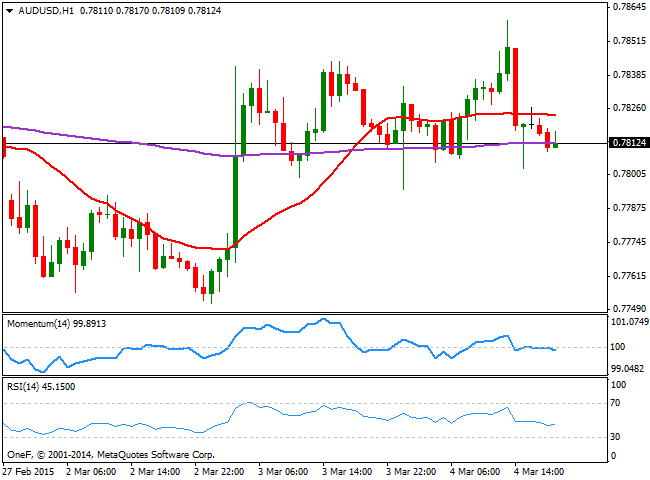
Australian dollar advanced up to 0.7859 against the greenback, despite local GDP figures barely matched expectations for the Q4 readings. The Australian dollar saw some short term demand during the past Asian session, finding support in the latest RBA decision to keep rates on hold at record lows of 2.25%. The release of the Central Bank decision, is now being investigated by the ASIC, the local corporate regulator of the foreign exchange market, as for the second month in a row, the pair has moved sharply in the direction of the surprise announcements, just seconds before the decisions were unveiled. Anyway, the Aussie finally capitulated to dollar's strength, falling down to find short term support around 0.7800. Technically, the 1 hour chart presents a neutral technical stance, with the technical indicators flat around their mid-lines, while the price stands a few pips below a horizontal 20 SMA. In the 4 hours chart the price hovers a few pips above a flat 20 SMA, whilst the technical indicators turned lower and are now approaching their mid-lines, limiting the chances of a stronger advance.
Support levels: 0.7800 0.7755 0.7720
Resistance levels: 0.7840 0.7890 0.7925
Recommended Content
Editors’ Picks
EUR/USD clings to daily gains above 1.0650

EUR/USD gained traction and turned positive on the day above 1.0650. The improvement seen in risk mood following the earlier flight to safety weighs on the US Dollar ahead of the weekend and helps the pair push higher.
GBP/USD recovers toward 1.2450 after UK Retail Sales data

GBP/USD reversed its direction and advanced to the 1.2450 area after touching a fresh multi-month low below 1.2400 in the Asian session. The positive shift seen in risk mood on easing fears over a deepening Iran-Israel conflict supports the pair.
Gold holds steady at around $2,380 following earlier spike

Gold stabilized near $2,380 after spiking above $2,400 with the immediate reaction to reports of Israel striking Iran. Meanwhile, the pullback seen in the US Treasury bond yields helps XAU/USD hold its ground.
Bitcoin Weekly Forecast: BTC post-halving rally could be partially priced in Premium

Bitcoin price shows no signs of directional bias while it holds above $60,000. The fourth BTC halving is partially priced in, according to Deutsche Bank’s research.
Week ahead – US GDP and BoJ decision on top of next week’s agenda

US GDP, core PCE and PMIs the next tests for the Dollar. Investors await BoJ for guidance about next rate hike. EU and UK PMIs, as well as Australian CPIs also on tap.