The week ahead is full of promises, with several Central Bank meetings all through the world. And, all of them, point to give the greenback further support, starting with the surprise rate cut in China and the long anticipated ECB launch of QE.
Canadian GDP is the most relevant data for this Tuesday, with the Canadian dollar already under pressure ahead of the data, above the 1.2500 level. German Retail Sales early in Europe will be the only other relevant data in the calendar.
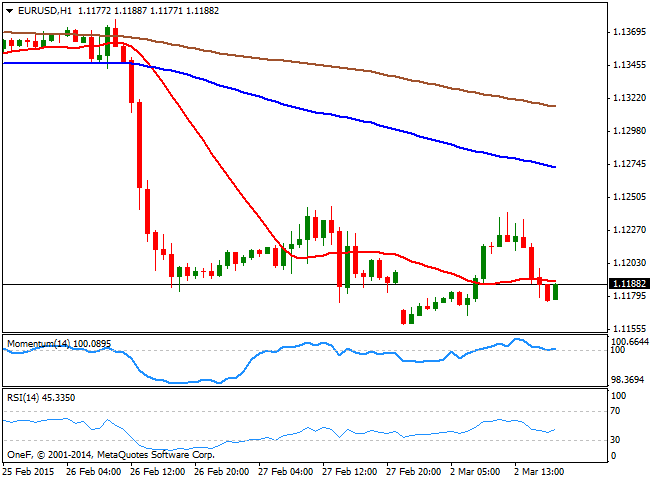
EUR/USD Current price: 1.1186
View Live Chart for the EUR/USD
Nevertheless the common currency is set to remain under selling pressure amid speculation the ECB will start flooding the region with extra money. From a technical point of view, the 1 hour chart shows that the price develops well below its 100 SMA, currently around 1.1270, while the price struggles around a flat 20 SMA and the technical indicators present a mild positive tone around their mid-lines, limiting the downside in the short term. In the 4 hours chart the 20 SMA has gained a strong bearish slope, acting as dynamic resistance around the critical 1.1250 level, while the Momentum indicator heads higher below 100 and the RSI stands around 37 after correcting overbought readings. Having set a weekly low around 1.1160, a break below the level should see the pair extending down to 1.1130, en route to 1.1097 this year low.
Support levels: 1.1160 1.1130 1.1095
Resistance levels: 1.1250 1.1285 1.1320
EUR/JPY Current price: 134.37
View Live Chart for the EUR/JPY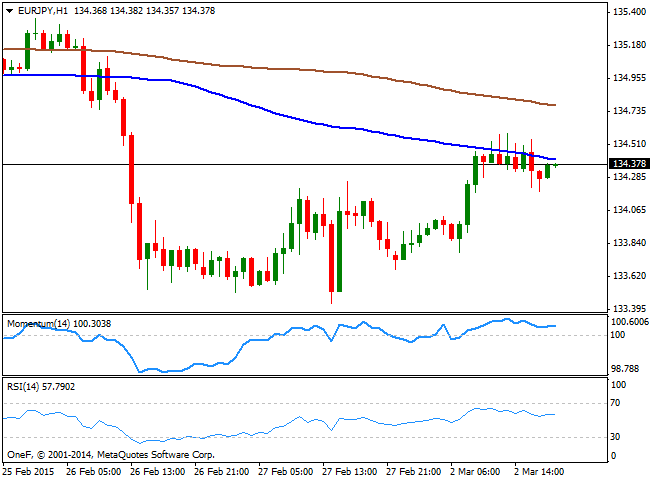
The Japanese Yen weakened against most rivals, in lack luster movements across the board. With no relevant data coming from Japan these days, the Asian currency is mostly being lead by stocks, as US indexes surged in the American afternoon, flirting with multi-year highs ahead of the close. As for the EUR/JPY, the 1 hour chart shows that the price is being limited by a bearish 100 SMA around the current level, whilst 200 SMA also presents a bearish slope around 134.85, becoming the key resistance in the case of additional advances. The Momentum indicator heads higher above 100 along with the RSI indicator, heading north around 59. In the 4 hours chart the price develops below its moving averages, while the technical indicators diverge between each other in neutral territory, giving no clear clues on upcoming moves.
Support levels: 134.00 133.65 133.20
Resistance levels: 134.85 135.20 135.50
GBP/USD Current price: 1.5372
View Live Chart for the GBP/USD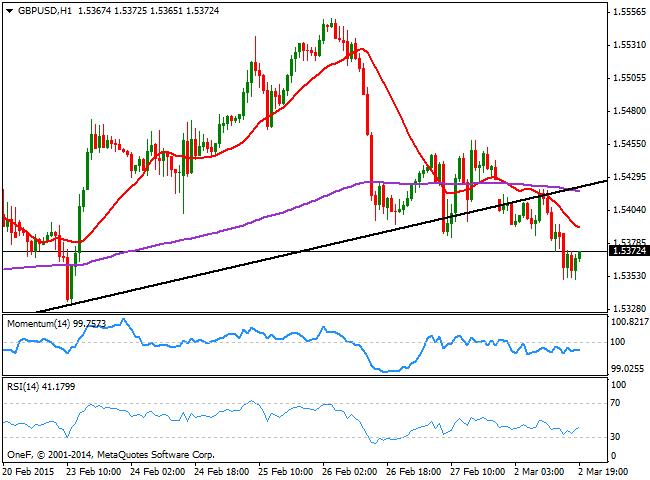
The GBP/USD pair fell down to 1.5350, despite the UK data resulted up beating, as the UK Markit Manufacturing PMI grew up to 54.1, the highest in seven months, from a revised 53.1 in January. British economy has seen a spike of activity, helped by lower oil prices reducing production costs. The BOE will have its monthly economic policy meeting this week, but no change is expected to be announced to the current rate or to the Assets Purchase Program. Technically, the 1 hour chart shows that the price broke below a daily ascendant trend line coming from 1.5208, February 12 daily low, and even completed a pullback to its before falling to fresh lows, supporting additional declines. In the same chart, the 20 SMA heads strongly lower above the current level, whilst the technical indicators present a mild bearish tone well below their mid-lines. In the 4 hours chart the 20 SMA heads lower above the current price, although the technical indicators are bouncing and approaching their mid-lines, still in negative territory. In this last time frame, the 200 EMA stands at 1.5340, while the pair has a low at 1.5331 from late February, becoming a critical support area for the upcoming hours; should the price break below, the pair will be exposed to further weakness, eyeing 1.5250 as the next probable bearish target.
Support levels: 1.5330 1.5290 1.5250
Resistance levels: 1.5420 1.5450 1.5490
USD/JPY Current price: 120.07
View Live Chart for the USD/JPY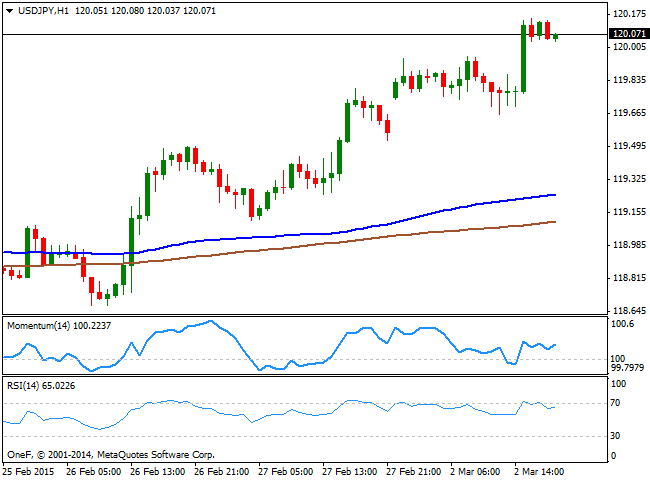
The USD/JPY pair surged above the 120.00 figure during the American afternoon, consolidating right below the daily high set at 1.20.15. The 1 hour chart for the pair shows that the price advanced further above its 100 and 200 SMAs', both in the 119.10/30 area, whilst the Momentum indicator heads higher above the 100 level, and the RSI also heads north around 65. In the 4 hours chart the price stands well above its moving averages although the Momentum indicator heads lower towards its mid-line, and the RSI holds around 70, suggesting a downward corrective movement is likely, particularly if the pair eases back below the 119.95 level.
Support levels: 119.95 119.40 118.80
Resistance levels: 120.45 120.90 121.45
AUD/USD Current price: 0.7772
View Live Chart for the AUD/USD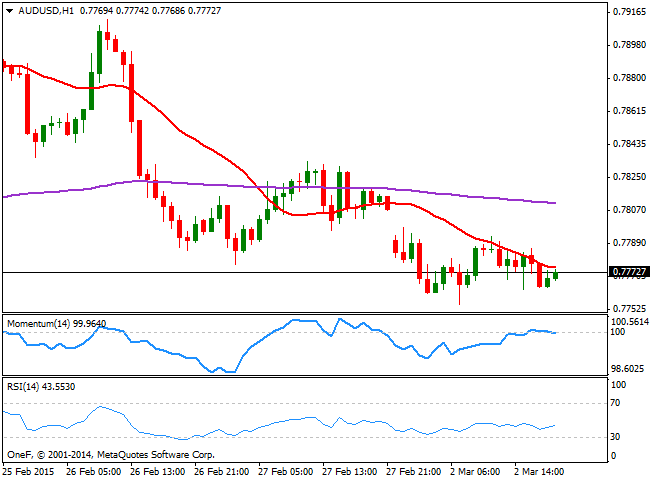
The AUD/USD pair traded under broad pressure all of this Monday, as the investors speculate the RBA can cut rates during the upcoming Asian session. The pair has been unable to fill the weekly opening gap at 0.7807, and the 1 hour chart shows that the 20 SMA capped the upside in the short term, maintaining a bearish slope ahead of Asian opening, while the Momentum indicator heads slightly lower around 100 and the RSI hovers around 42. In the 4 hours chart the 20 SMA maintains a bearish slope above the current level, while the Momentum aims higher below 100 and the RSI indicator presents a bearish slope around 40. The upcoming price action will depend on the RBA decision with an on-hold decision probably helping the pair to fill the mentioned weekly opening gap, and a rate cut favoring a decline below the 0.7700 level.
Support levels: 0.7755 0.7720 0.7680
Resistance levels: 0.7800 0.7840 0.7890
Recommended Content
Editors’ Picks
EUR/USD clings to daily gains above 1.0650

EUR/USD gained traction and turned positive on the day above 1.0650. The improvement seen in risk mood following the earlier flight to safety weighs on the US Dollar ahead of the weekend and helps the pair push higher.
GBP/USD recovers toward 1.2450 after UK Retail Sales data

GBP/USD reversed its direction and advanced to the 1.2450 area after touching a fresh multi-month low below 1.2400 in the Asian session. The positive shift seen in risk mood on easing fears over a deepening Iran-Israel conflict supports the pair.
Gold holds steady at around $2,380 following earlier spike

Gold stabilized near $2,380 after spiking above $2,400 with the immediate reaction to reports of Israel striking Iran. Meanwhile, the pullback seen in the US Treasury bond yields helps XAU/USD hold its ground.
Bitcoin Weekly Forecast: BTC post-halving rally could be partially priced in Premium

Bitcoin price shows no signs of directional bias while it holds above $60,000. The fourth BTC halving is partially priced in, according to Deutsche Bank’s research.
Week ahead – US GDP and BoJ decision on top of next week’s agenda

US GDP, core PCE and PMIs the next tests for the Dollar. Investors await BoJ for guidance about next rate hike. EU and UK PMIs, as well as Australian CPIs also on tap.
