EUR/USD Current price: 1.1354
View Live Chart for the EUR/USD
The American dollar edged lower against most of its rivals, extending its losses in the second day of Janet Yellen's testimony before the Senate, reiterating what the market already knew that is that no rate hike should be expected at least for the upcoming couple of meetings. Also this Wednesday, the ECB President gave his Annual Report before the European Parliament, and said that monetary policy can't create growth by itself, while extraordinary measures have been taking. Once again, nothing new was brought to the table. In the US, Sales of new single-family houses in January 2015 were at a seasonally adjusted annual rate of 481,000, according to estimates released jointly today by the U.S. Census Bureau and the Department of Housing and Urban Development.
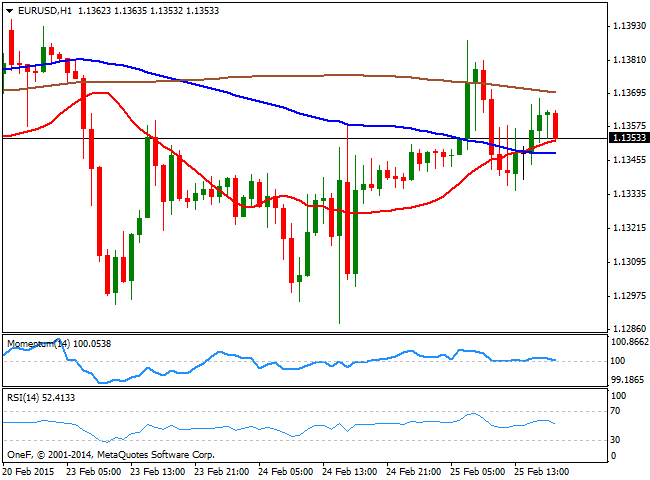
But the EUR/USD continues directionless, trading within quite a limited range around the 1.1300 figure. Short term, the 1 hour chart shows that an early spike up to 1.1388 was quickly reverted and the technical indicators in the mentioned time frame remain in neutral territory. In the 4 hours chart the technical picture remains neutral, with the technical indicators hovering around their mid-lines and the price around a flat 20 SMA. At this point, there is nothing suggesting the 1.1250/1.1440 range will be violated any time soon.
Support levels: 1.1320 1.1280 1.1250
Resistance levels: 1.1380 1.1440 1.1485
EUR/JPY Current price: 134.75
View Live Chart for the EUR/JPY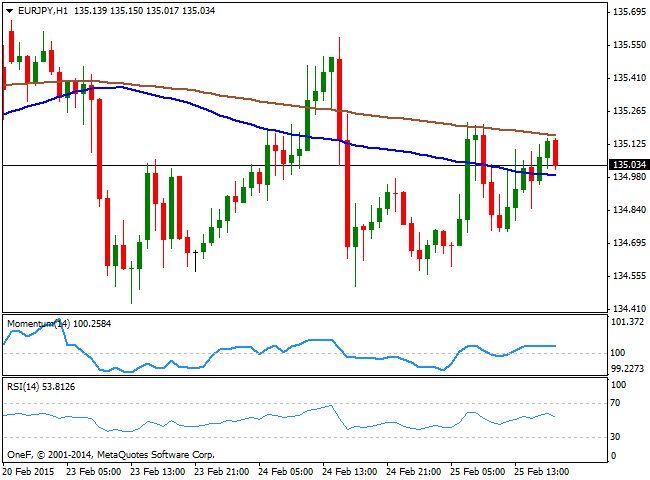
The Japanese Yen came under limited selling pressure during the last 24 hours, boosted by risk appetite as stocks held near all-time highs whilst earlier in the day, an up beating Chinese PMI brought relief to Asian currencies. The EUR/JPY pair struggles to hold above the 135.00 level, and the 1 hour chart shows that the price consolidates between 100 and 200 SMAs while the technical indicators lose their upward strength in positive territory. In the 4 hours chart the price converges with both 100 and 200 SMAs, a clear sign of the current lack of direction, whilst the indicators present a tepid positive tone above their mid-lines. Nevertheless, some steadier advance above the 135.50 level is required to confirm further advances in the pair while a break below 134.50 should see the pair resuming the downside.
Support levels: 134.50 134.00 133.65
Resistance levels: 135.20 135.50 135.85
GBP/USD Current price: 1.5520
View Live Chart for the GBP/USD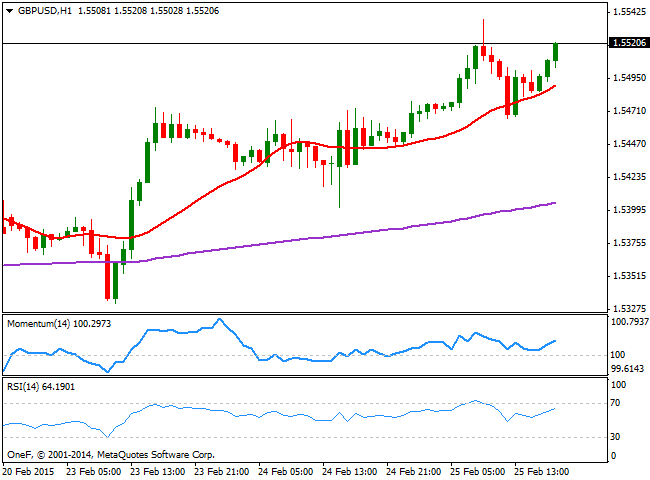
The GBP/USD pair surged to a fresh 8-week high of 1.5537, with the Pound boosted by BOE's members. Governor Mark Carney in his early speech, reiterated the stance presented in the Quarterly Inflation report, but BOE's Forbes surprised with a hawkish tone, suggesting a rate hike in the nearer future may be needed to ensure financial stability. The pair retraced early US session down to the 1.5460 price zone, from where it bounced back above the 1.5500 figure, supporting some additional gains for the upcoming sessions. From a technical point of view, the 1 hour chart shows that the price stands above a bullish 20 SMA whilst the indicators are losing some upward potential well above their mid-lines. In the 4 hours chart however, the price remains well above its 20 SMA while the Momentum indicator heads strongly up above 100 and the RSI follows around 66. Renewed buying interest above 1.5535 should lead to a retest of this year high of 1.5582, while a break above this last exposes the 1.5660 price zone, as next main bullish target.
Support levels: 1.5490 1.5450 1.5420
Resistance levels: 1.5535 1.5580 1.5620
USD/JPY Current price: 118.94
View Live Chart for the USD/JPY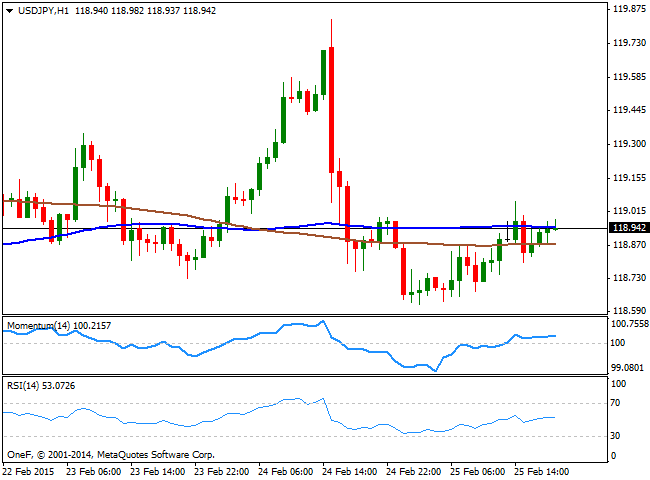
The USD/JPY pair recovered from a daily low of 118.67, but once again failed to post sustainable gains above the 119.00 level. The 1 hour chart shows that the pair has spent most of the American afternoon consolidating around its 100 and 200 SMAs, both horizontal, while the technical indicators stand directionless in positive territory. In the 4 hours chart, the price held above a bullish 100 SMA, while the technical indicators aim slightly higher around their mid-lines, lacking directional strength. The pair needs to break either above 119.40, or below 118.25 to be able to establish a clearer trend in the short term, although some follow through above 120.00 or below 117.70 is required to confirm a more directional move.
Support levels: 118.60 118.25 117.70
Resistance levels: 119.40 119.85 120.20
AUD/USD Current price: 0.7899
View Live Chart for the AUD/USD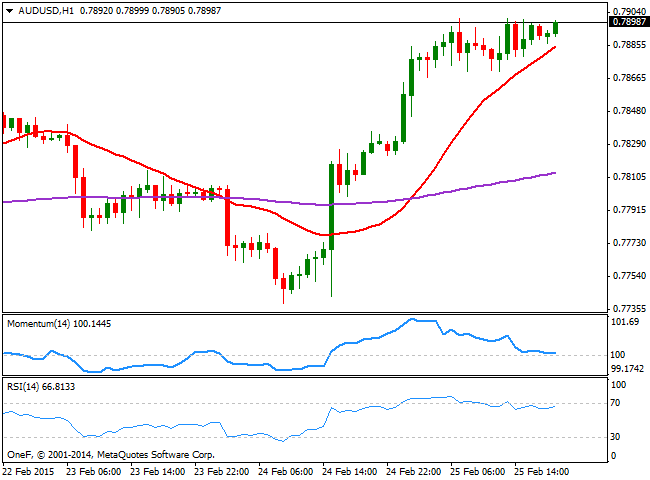
The AUD/USD pair advanced towards the 0.7900 figure during the last Asian session, boosted by Chinese data, as the local HSBC Flash Manufacturing PMI surprised with a rise above the critical 50 mark, up to 50.1 points in February. Australian data however, was hardly encouraging, as construction work for the Q4 of 2014 showed weaker conditions than in the previous quarter, while Australian wage inflation held near record lows, in line with the global deflationary theme. Nevertheless, the pair held near the mentioned 0.7900 level, and the 1 hour chart shows that the price pressures it, despite the Momentum indicator diverges lower, resting near its 100 level. The RSI indicator in the mentioned time frame however, aims higher around 65, while in the 4 hours chart the technical indicators maintain strong upward slopes that support further advances. In this last time frame, the 200 EMA acts as dynamic resistance around the mentioned high, having been capping the upside since July 2014. Therefore, additional advances above the level should signal an interim bottom has come into place, pointing for an extension towards the 0.8000 figure.
Support levels: 0.7865 0.7830 0.7780
Resistance levels: 0.7900 0.7940 0.7990
Recommended Content
Editors’ Picks
EUR/USD fluctuates near 1.0700 after US data

EUR/USD stays in a consolidation phase at around 1.0700 in the American session on Wednesday. The data from the US showed a strong increase in Durable Goods Orders, supporting the USD and making it difficult for the pair to gain traction.
USD/JPY refreshes 34-year high, attacks 155.00 as intervention risks loom

USD/JPY is renewing a multi-decade high, closing in on 155.00. Traders turn cautious on heightened risks of Japan's FX intervention. Broad US Dollar rebound aids the upside in the major. US Durable Goods data are next on tap.
Gold stays in consolidation above $2,300

Gold finds it difficult to stage a rebound midweek following Monday's sharp decline but manages to hold above $2,300. The benchmark 10-year US Treasury bond yield stays in the green above 4.6% after US data, not allowing the pair to turn north.
Worldcoin looks set for comeback despite Nvidia’s 22% crash Premium

Worldcoin price is in a better position than last week's and shows signs of a potential comeback. This development occurs amid the sharp decline in the valuation of the popular GPU manufacturer Nvidia.
Three fundamentals for the week: US GDP, BoJ and the Fed's favorite inflation gauge stand out Premium

While it is hard to predict when geopolitical news erupts, the level of tension is lower – allowing for key data to have its say. This week's US figures are set to shape the Federal Reserve's decision next week – and the Bank of Japan may struggle to halt the Yen's deterioration.