EUR/USD Current price: 1.1307
View Live Chart for the EUR/USD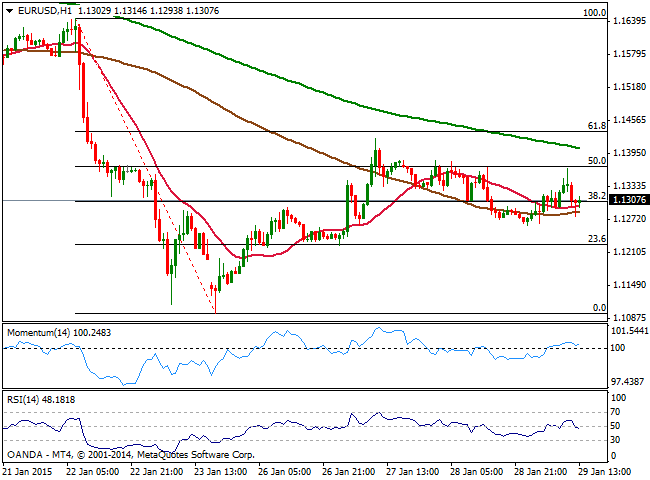
The dollar was back on Thursday, edging higher against most of its rivals, with the surprising exception of the EUR. The common currency traded in positive territory ever since opening the day in the 1.1260 price zone past Asian session, finding some support early Europe in German unemployment rate, down to 6.5% the lowest on record. Inflation in the country however, declined below expected, falling for the first time in 5 years and signaling the strongest economy of the EZ was unable to escape deflation. US data on the other hand was mixed, with weekly unemployment claims down to 265K last week, the best in 15 years, while Pending Home Sales stalled in December, losing 3.7% but above year-over-year levels for the fourth consecutive month. On Friday, Europe will release its monthly inflation figures, expected to fall further.
In the meantime the EUR/USD par presents a quite neutral short term technical stance, as per having been trading in between Wednesday range, once again limited to the upside by 1.1365, 50% retracement of the latest daily slide. The 1 hour chart shows that price hovers around the 38.2% retracement of the same rally at 1.1305 with 20 and 100 SMAs right below the current levels and indicators directionless around their midlines. In the 4 hours chart price is stuck around a mild bullish 20 SMA that converges with the mentioned 38.2% retracement, while indicators are turning lower in neutral territory, lacking directional strength. The price needs to break below 1.1250 to resume the downside, whilst selling interest will continue to surge at 1.1365 and higher, around the 1.1400 figure.
Support levels: 1.1250 1.1210 1.1160
Resistance levels: 1.1365 1.1400 1.1440
EUR/JPY Current price: 133.92
View Live Chart for the EUR/JPY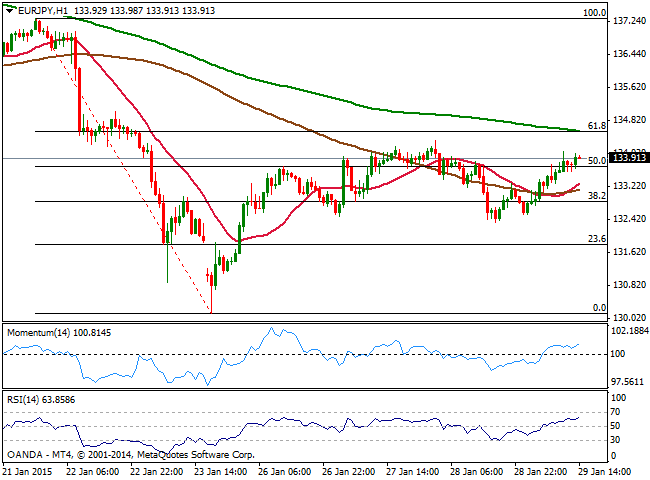
Japanese yen lost some ground late US afternoon, supported by rising stocks as US indexes bounced back after two days of sharp losses. Later today, Japan will release its National and Tokyo inflation figures, unemployment data and industrial production figures, all of which may end up setting a clearer trend in JPY crosses, considering range has prevailed for most of this week. As for the EUR/JPY, the 1 hour chart shows that the price established above the 50% retracement of the latest daily decline at 113.70, the immediate support, also advancing above 20 and 100 SMAS, whilst indicators aim higher above their midlines, supporting an upward continuation. In the 4 hours chart, the price advanced above its 20 SMA although remains well below 100 and 200 SMAs, while indicators present a quite neutral stance. The 61.8% retracement of the same rally stands at 134.55, and it will take a clear break above it to confirm a steadier advance towards the 135.00 level.
Support levels: 113.70 113.25 112.80
Resistance levels: 134.10 134.55 135.00
GBP/USD Current price: 1.5044
View Live Chart for the GBP/USD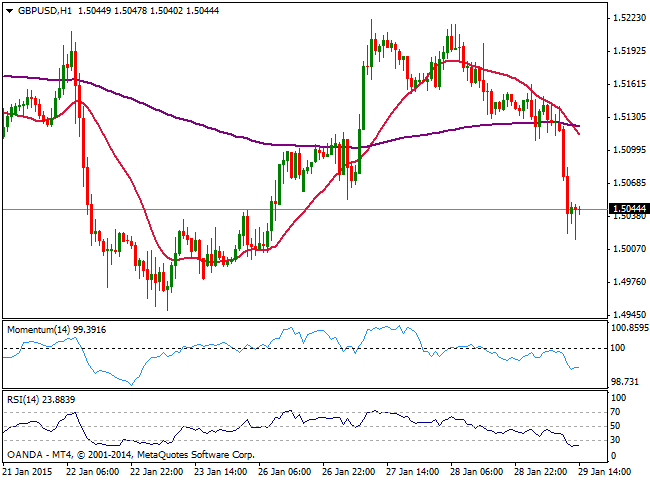
Having been under pressure since the day started, the Cable triggered stops below the 1.5100 level mid American afternoon, falling down to 1.5016 before posting a mild bounce. Nevertheless, the GBP/USD pair has largely resumed the downside after failing to advance beyond 1.5220, completing the short term double roof figure seen on previous update. The 1 hour chart shows that the price accelerated below a bearish 20 SMA that capped the upside most of this Thursdays, while indicators finally lost their bearish momentum and turned flat in oversold territory, far from suggesting a change in the trend. In the 4 hours chart price broke below its 20 SMA whilst indicators maintain a strong bearish momentum below their midlines, supporting some further declines particularly on a break below 1.5010 the immediate support.
Support levels: 1.5010 1.4970 1.4925
Resistance levels: 1.5060 1.5100 1.5150
USD/JPY Current price: 118.41
View Live Chart for the USD/JPY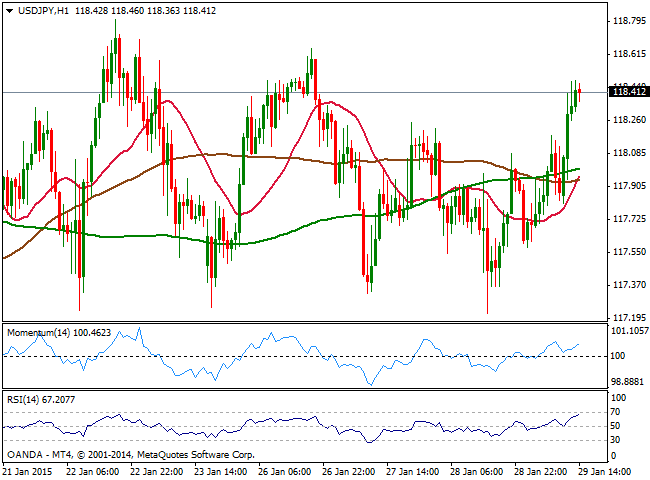
The USD/JPY edged towards the high of its recent range late US session, but continues to lack directional potential, still contained between 117.00 and 118.80. The 1 hour chart shows that price extended above its moving averages all in a tight 10 pips range, and therefore meaningless, while indicators head higher above their midlines. In the 4 hours chart indicators are aiming to cross above their midlines, but for the most the outlook is still neutral. As commented on previous updates, unless a clear break of the mentioned range there’s little to do with the pair but play it.
Support levels: 118.00 117.60 117.30
Resistance levels: 118.50 118.90 119.35
AUD/USD Current price: 0.7754
View Live Chart of the AUD/USD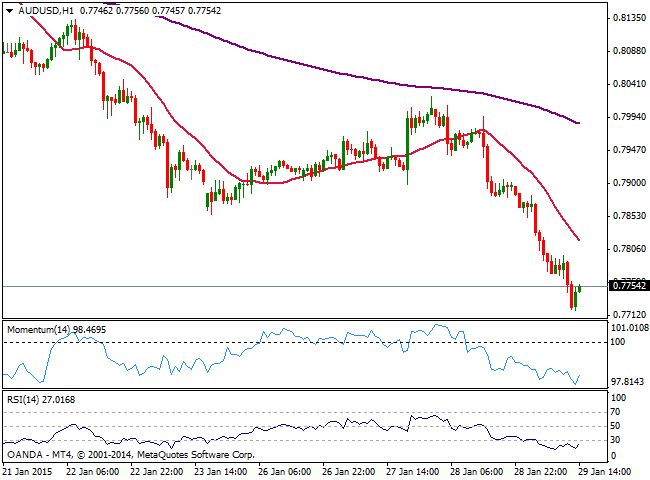
Australian dollar tumbled this Thursday, weighted early opening by the decline in NZD following a dovish RBNZ. The AUD/USD pair extended its decline all through the day as gold nose-dived towards$ 1,250/oz. price zone, where it stands. The pair fell as low as 0.7719, level not seen since July 2009, and the 1 hour chart shows indicators aiming to bounce, but still in extreme oversold levels, while 20 SMA maintains a strong bearish slope well above current price, in the 0.7820 price zone. In the 4 hours chart the decline seems poised to extend as indicators maintain their strong bearish slopes well into negative territory. The 0.7700 level comes as key support as July 2009 monthly low stands at 0.7702, with a break below it supporting a continued decline for the last day of the month.
Support levels: 0.7700 0.7665 0.7630
Resistance levels: 0.7820 0.7860 0.7900
Recommended Content
Editors’ Picks
AUD/USD pressures as Fed officials hold firm on rate policy

The Australian Dollar is on the defensive against the US Dollar, as Friday’s Asian session commences. On Thursday, the antipodean clocked losses of 0.21% against its counterpart, driven by Fed officials emphasizing they’re in no rush to ease policy. The AUD/USD trades around 0.6419.
EUR/USD extends its downside below 1.0650 on hawkish Fed remarks

The EUR/USD extends its downside around 1.0640 after retreating from weekly peaks of 1.0690 on Friday during the early Asian session. The hawkish comments from Federal Reserve officials provide some support to the US Dollar.
Gold price edges higher on risk-off mood hawkish Fed signals

Gold prices advanced late in the North American session on Thursday, underpinned by heightened geopolitical risks involving Iran and Israel. Federal Reserve officials delivered hawkish messages, triggering a jump in US Treasury yields, which boosted the Greenback.
Runes likely to have massive support after BRC-20 and Ordinals frenzy

With all eyes peeled on the halving, Bitcoin is the center of attention in the market. The pioneer cryptocurrency has had three narratives this year already, starting with the spot BTC exchange-traded funds, the recent all-time high of $73,777, and now the halving.
Billowing clouds of apprehension

Thursday marked the fifth consecutive session of decline for US stocks as optimism regarding multiple interest rate cuts by the Federal Reserve waned. The downturn in sentiment can be attributed to robust economic data releases, prompting traders to adjust their expectations for multiple rate cuts this year.