EUR/USD Current price: 1.1365
View Live Chart for the EUR/USD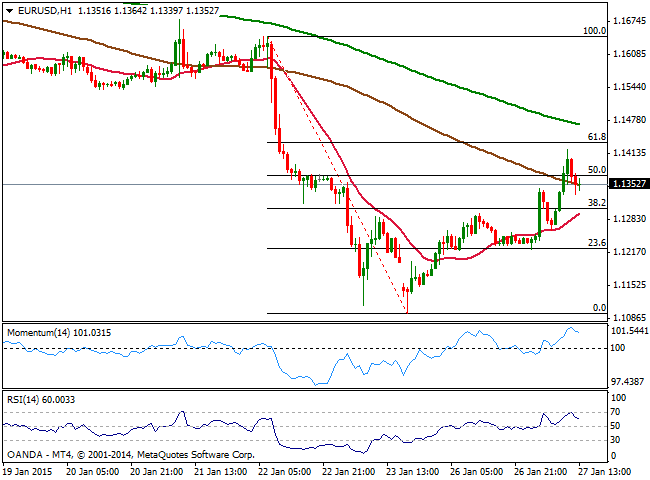
The EUR/USD pair recovered up to 1.1422 this Tuesday on the back of tepid American data and more SNB. Early Europe, the Switzerland National Bank vice chairman announced the Bank is watching franc against EUR and USD, and may intervene if necessary, giving the EUR some intraday support and boosting the pair above the 1.1300 figure. But most of dollar weakness came from US indexes fall, as disappointing earnings reports drove DJIA down around 380 points intraday. US Durable Goods Orders decreased 3.4% in December a straight 4-month drop, and pointing out the global slowdown is affecting American companies. Later on the day, Markit Services PMI and Consumer confidence ticked higher yet were not enough to revive dollar demand. The FED will have its first meeting of the year tomorrow, and market players are anticipating the Central Bank may hold back on a rate hike considering inflation is likely to remain subdue. Nevertheless, majors will likely range ahead of the news, for most of this upcoming Wednesday.
From a technical point of view, the 1 hour chart shows that the EUR/USD pair trades around the 50% retracement of the post ECB QE announcement fall, although price holds well above its 20 SMA and indicators regain the upside after a limited correction from overbought levels. In the 4 hours chart technical indicators maintain a strong upward momentum, while 20 SMA turns flat below current price, suggesting the rally may extend, particularly if the pair manages to extend its gains above 1.1440, the 61.8% retracement of the same rally.
Support levels: 1.1335 1.1310 1.1250
Resistance levels: 1.1400 1.1440 1.1485
EUR/JPY Current price: 133.99
View Live Chart for the EUR/JPY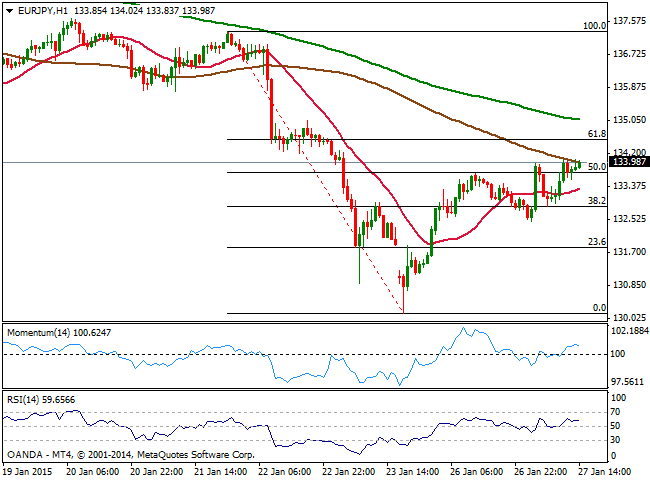
The EUR/JPY pair struggles around the 134.00 figure, having followed EUR/USD in its upward corrective movement. The Japanese yen strengthened earlier on the day, as stocks fell in the US, but late recovery in index from their daily lows, push the JPY lower in the American afternoon. The 1 hour chart for the pair shows that price pressures the 100 SMA around current levels, whilst indicators hold above their midlines, albeit showing no actual strength. The pair has corrected the 50% of its latest fall, with immediate support now at 133.70. In the 4 hours chart indicators are biased higher above their midlines, supporting a continued advance particularly if the pair manages to break above 134.55, 61.8% retracement of the same decline.
Support levels: 133.70 133.25 132.85
Resistance levels: 134.55 135.10 135.65
GBP/USD Current price: 1.5200
View Live Chart for the GBP/USD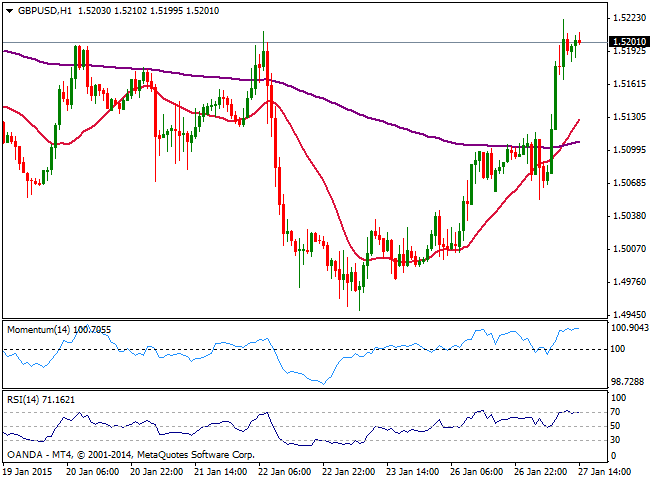
The GBP/USD pair posted a strong intraday advance, considering it bounced from a daily low of 1.5054 reached after UK GDP release. In the European morning, news showed the UK economic growth slowed more than expected in 2014 as it only grew 0.5% in the last quarter of the year, leaving the annual rate at 2.7%. But strong demand surged on former highs and the pair finally triggered stops above 1.5125, reaching 1.5224 fresh 2-weeks high. Technically, the pair remains biased higher, as the 1 hour chart shows 20 SMA advancing strongly higher well below current price, whilst indicators turn flat in overbought territory, far from signaling an upcoming downward move. In the 4 hours chart indicators also present a strong bullish tone, supporting the shorter term view. A break above mentioned high should lead to an advance up to 1.5330, 200 EMA in this last time frame, while bulls may hesitate if price eases back below the 1.5120/30 price zone.
Support levels: 1.5170 1.5125 1.5080
Resistance levels: 1.5225 1.5265 1.5300
USD/JPY Current price: 117.84
View Live Chart for the USD/JPY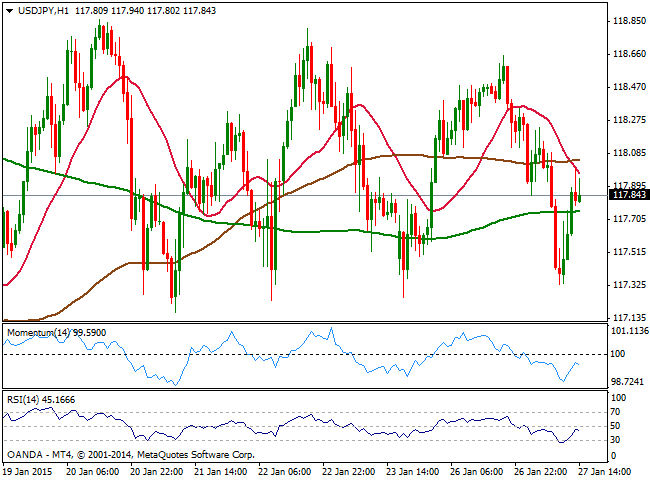
The USD/JPY pair remained contained within its latest range despite stocks’ strong slide and US 10Y yields falling down to 1.80%, as the pair bounced from a daily low of 117.33. The one hour chart shows 20 SMA crossed below the 100 one above current price, capping the upside around 118.00, while indicators turned lower right below their midlines, after correcting oversold readings. In the 4 hours chart the price stands below its moving averages whilst indicators present a mild bearish tone, as per heading lower right below their midlines. Wednesday FED decision may be the trigger the pair needs to breakout its range: if the Central Bank suggests a rate hike may be delayed to late in the year, stocks will welcome the news and the pair may follow, reverting the ongoing heavy short term tone.
Support levels: 117.60 117.30 117.00
Resistance levels: 118.00 118.40 118.90
AUD/USD Current price: 0.7933
View Live Chart of the AUD/USD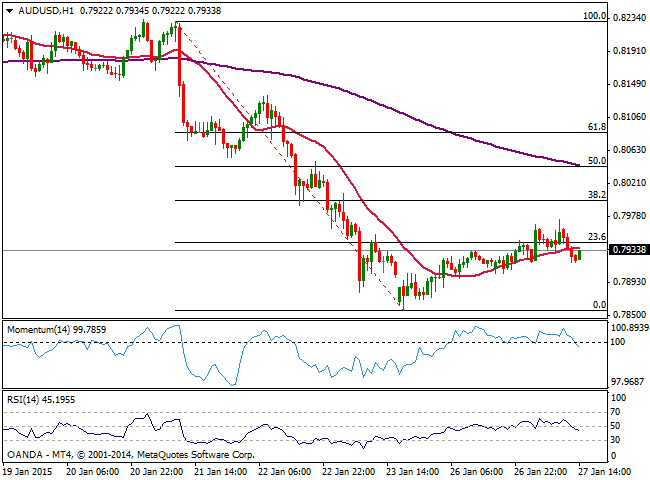
Australian dollar remained subdued against the greenback, as the pair saw a limited advance up to 0.7974 before easing back towards its daily opening level. Aussie will have to face local inflation data to be release during the upcoming Asian session, expected to have shrink to 1.8% in the last quarter of 2014, against previous quarter reading of 2.3%. A reading below expected should keep the pair in bearish mode, while strong selling interest still stands around the 0.7965 price zone. The 1 hour chart shows that price broke below its 20 SMA while indicators head lower below their midlines, pointing for some further declines in the short term. In the 4 hours chart price struggles around a strongly bearish 20 SMA, while indicators hovers around their midlines, diverging from each other and therefore not giving a clear directional bias.
Support levels: 0.7900 0.7860 0.7820
Resistance levels: 0.7965 0.8000 0.8040
Recommended Content
Editors’ Picks
EUR/USD clings to daily gains above 1.0650

EUR/USD gained traction and turned positive on the day above 1.0650. The improvement seen in risk mood following the earlier flight to safety weighs on the US Dollar ahead of the weekend and helps the pair push higher.
GBP/USD recovers toward 1.2450 after UK Retail Sales data

GBP/USD reversed its direction and advanced to the 1.2450 area after touching a fresh multi-month low below 1.2400 in the Asian session. The positive shift seen in risk mood on easing fears over a deepening Iran-Israel conflict supports the pair.
Gold holds steady at around $2,380 following earlier spike

Gold stabilized near $2,380 after spiking above $2,400 with the immediate reaction to reports of Israel striking Iran. Meanwhile, the pullback seen in the US Treasury bond yields helps XAU/USD hold its ground.
Bitcoin Weekly Forecast: BTC post-halving rally could be partially priced in Premium

Bitcoin price shows no signs of directional bias while it holds above $60,000. The fourth BTC halving is partially priced in, according to Deutsche Bank’s research.
Week ahead – US GDP and BoJ decision on top of next week’s agenda

US GDP, core PCE and PMIs the next tests for the Dollar. Investors await BoJ for guidance about next rate hike. EU and UK PMIs, as well as Australian CPIs also on tap.