EUR/USD Current price: 1.1145
View Live Chart for the EUR/USD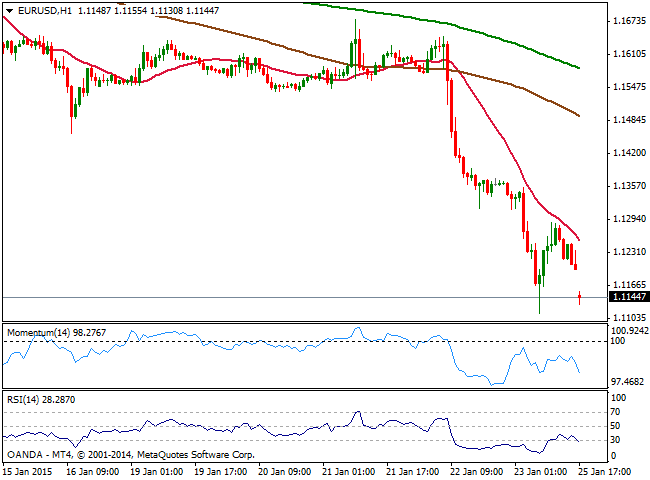
The EUR/USD pair sees no relief, gapping lower at the opening and trading around the 1.1150 area, as news anticipate Syriza left-right has taken over Greece. With around 50% of the votes counted, the party has taken 36% of the vote at the General election, which guarantees 148 seats in the Parliament. Syriza’s victory sparks fears the country may default on its debt and eventually leave the Euro area, adding further pressure on the already vulnerable common currency. The EUR/USD has traded at low as 1.1113 on Friday, sold off after the ECB announced quantitative easing of over €1 Trillion, bouncing afterwards up to 1.1286 before closing below the 1.1200 level.
The overall bearish momentum is poised to extend further this week, and the short term picture favors the downside, as the 1 hour chart shows that the price retraced from a strongly bearish 20 SMA, whilst indicators turned south after correcting oversold readings, now sharply lower on the weekly opening gap. The 4 hours chart shows a strong bearish momentum coming from indicators with RSI retracing from the 30 level and supporting further declines, particularly on a break below the mentioned record low.
Support levels: 1.1115 1.1075 1.1040
Resistance levels: 1.1200 1.1245 1.1290
EUR/JPY Current price: 131.21
View Live Chart for the EUR/JPY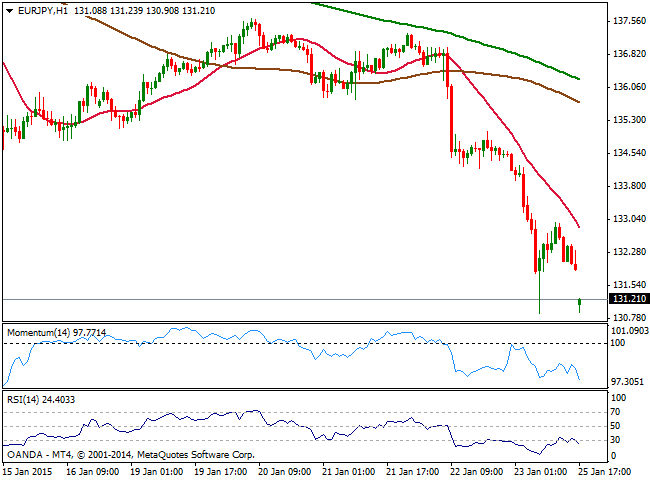
The EUR/JPY tests last week lows around 130.90 at the opening, with the pair also gapping lower on Euro weakness. The pair has lost around 650 pips during these last two days, and seems in no aims to turn direction as the 1 hour chart shows that the price is developing well below its moving averages, whilst indicators turned back south after a limited upward correction. In the 4 hours chart technical indicators present a strong downward momentum despite in extreme oversold levels, whilst moving averages gain bearish slope well above the current price
Support levels: 130.90 129.70 129.25
Resistance levels: 131.40 131.90 132.50
GBP/USD Current price: 1.4996
View Live Chart for the GBP/USD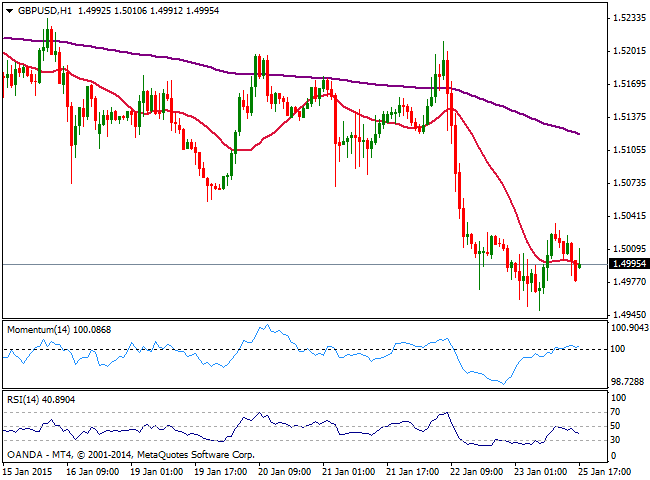
The GBP/USD pair surges on euro weakness, as the EUR/GBP sinks to new 6-years lows, with the Pound hovering around the 1.5000 figure against the greenback at the opening. The Pound suffered last week as the latest BOE Minutes showed all 9 voting members choose to keep rates on hold amid increasing risk of falling inflation. The pair however saw a limited slide down to 1.4950 now the immediate support level for this Monday. Technically the 1 hour chart shows that the price hovers around a flat 20 SMA whilst indicators hold in negative territory, giving no support to current short term advance. In the 4 hours chart technical readings are biased lower well into negative territory, favoring more greenback gains, furthermore if mentioned 1.4950 level gives up, aiming for a test of 1.4860 strong static support.
Support levels: 1.4950 1.4910 1.4860
Resistance levels: 1.5035 1.5080 1.5125
USD/JPY Current price: 117.66
View Live Chart for the USD/JPY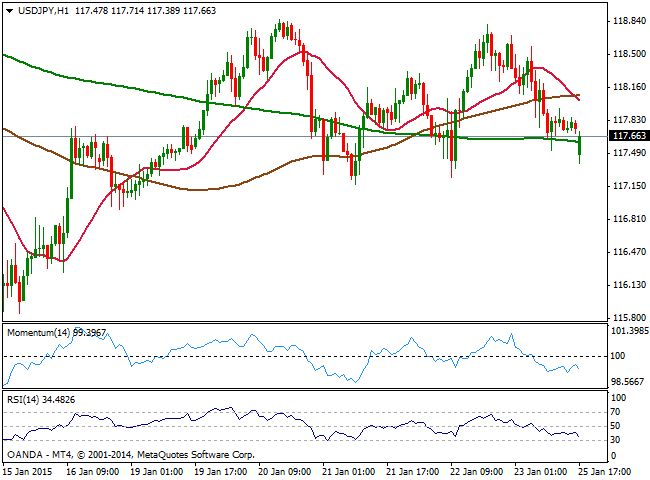
While market attention is captive on European developments, the BOJ will release the Minutes of its latest monthly economic policy meeting and it trade balance figures later on the day, expected to have little effect in a market lead by sentiment. The USD/JPY pair has found strong selling interest around the 118.20 area last week, and the 1 hour chart shows a short term double roof in the area, with the neckline set around 117.00/10, the immediate support area. The same chart shows that price gapped below its 200 SMA currently at 117.60 offering short term resistance, whilst indicators present a clear bearish tone. In the 4 hours chart the price develops also below moving averages while indicators present a mild negative tone around their midlines, lacking directional strength at the time being. A break below the 117.00/10 area is required to confirm a new leg lower, targeting the critical 115.50 area during the upcoming sessions.
Support levels: 117.05 116.60 116.20
Resistance levels: 117.60 117.90 118.25
AUD/USD Current price: 0.7876
View Live Chart of the AUD/USD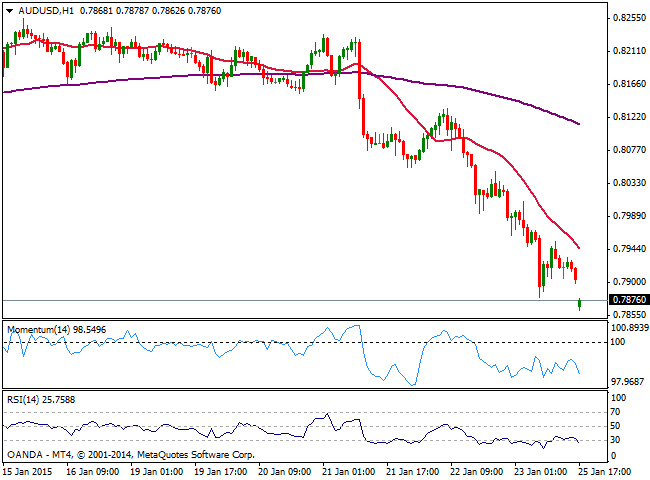
The AUD/USD pair falls to a fresh multi-year low around 0.7860 at the opening, gapping lower on dollar demand. After consolidating for almost two weeks above the key psychological figure of 0.8000, the pair resumed its slide following ECB’s movement that boosted dollar demand. The short term picture shows a strong bearish momentum coming from technical indicators, whilst 20 SMA is almost vertical above the current levels, while in the 4 hours chart, RSI resumed its decline below 30 and momentum hovers directionless in extreme oversold readings. Bears will likely maintain the lead, with pullbacks up to critical 0.7960 seen as selling opportunities, as the level stands for the 61.8% retracement of the 2008/2011 bullish run.
Support levels: 0.7850 0.7810 0.7770
Resistance levels: 0.7900 0.7960 0.8000
Recommended Content
Editors’ Picks
AUD/USD remained bid above 0.6500

AUD/USD extended further its bullish performance, advancing for the fourth session in a row on Thursday, although a sustainable breakout of the key 200-day SMA at 0.6526 still remain elusive.
EUR/USD faces a minor resistance near at 1.0750

EUR/USD quickly left behind Wednesday’s small downtick and resumed its uptrend north of 1.0700 the figure, always on the back of the persistent sell-off in the US Dollar ahead of key PCE data on Friday.
Gold holds around $2,330 after dismal US data

Gold fell below $2,320 in the early American session as US yields shot higher after the data showed a significant increase in the US GDP price deflator in Q1. With safe-haven flows dominating the markets, however, XAU/USD reversed its direction and rose above $2,340.
Bitcoin price continues to get rejected from $65K resistance as SEC delays decision on spot BTC ETF options

Bitcoin (BTC) price has markets in disarray, provoking a broader market crash as it slumped to the $62,000 range on Thursday. Meanwhile, reverberations from spot BTC exchange-traded funds (ETFs) continue to influence the market.
US economy: slower growth with stronger inflation

The dollar strengthened, and stocks fell after statistical data from the US. The focus was on the preliminary estimate of GDP for the first quarter. Annualised quarterly growth came in at just 1.6%, down from the 2.5% and 3.4% previously forecast.