EUR/USD Current price: 1.1603
View Live Chart for the EUR/USD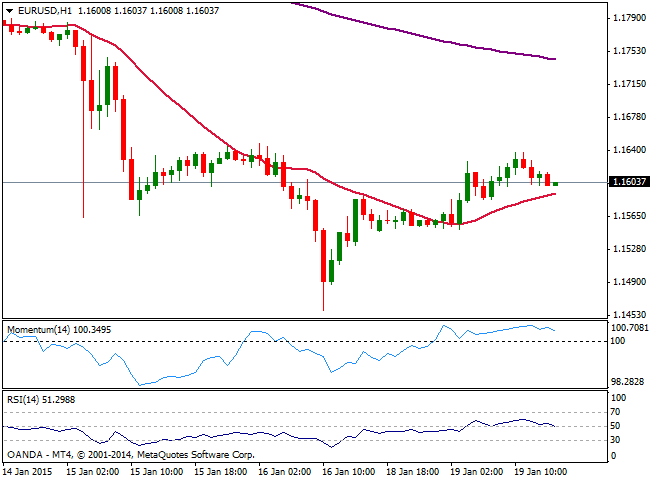
Uninspired currency traders spent this Monday squaring positions ahead of the event of the week, the ECB. The fact that the US banks were closed on holidays helped to keep majors subdued. With no fundamental data to give leads, news focused for the most on the European Central Bank, not speculating whether or not the Central Bank will launch QE this week, but how much it will be. Market talks these days suggest something between €500B and €750B in the form of sovereign bond purchases, although post SNB latest reaction, the figures extend up to €1T in some cases. Greece elections next Sunday are surely receiving attention too, as the opposition party Syriza is largely expected to win. For this Tuesday, German PPI and ZEW survey will insure some action early Europe, being the last barometers of the European heath.
From a technical point of view, the EUR/USD posted a limited recovery daily basis, stalling below the 1.1650 mark. In the short term, the 1 hour chart presents a mild positive tone, as per indicators aiming higher above their midlines and the price developing above its 20 SMA, although lacking real strength. In the 4 hours chart indicators continue correcting higher from oversold levels but far below their midlines, while 20 SMA caps the upside now around 1.1630 acting as immediate short term resistance. A recovery above the level should see the pair extending its recovery up to 1.1730 probable top for this Tuesday if somehow the bullish momentum accelerates.
Support levels: 1.1580 1.1545 1.1510
Resistance levels: 1.1640 1.1680 1.1730
EUR/JPY Current price: 136.61
View Live Chart for the EUR/JPY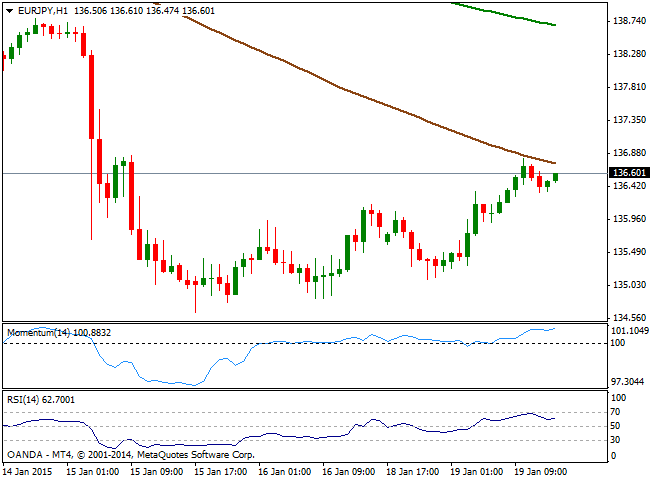
The yen advanced against most of its rivals during previous Asian session, amid a strong slump in Chinese stocks, with the Shanghai Composite losing over 6% on the day after the China Securities Regulatory Commission decided to restrict margin lending. But the positive tone in European stocks markets eased the pressure over the safe-haven yen that turned lower across the board. In the case of the EUR/JPY, the pair advanced up to 136.81, finding short term selling interest in a bearish 100 SMA in the 1 hour chart, where indicators maintain a positive tone above their midlines. In the 4 hours chart indicators present a stronger upward momentum approaching their midlines from below, still not confirming further gains. Some follow through above the mentioned 100 SMA should support a short term advance for today, whilst below 136.20 the risk turns back to the downside.
Support levels: 136.20 135.70 135.30
Resistance levels: 136.85 137.40 137.90
GBP/USD Current price: 1.5122
View Live Chart for the GBP/USD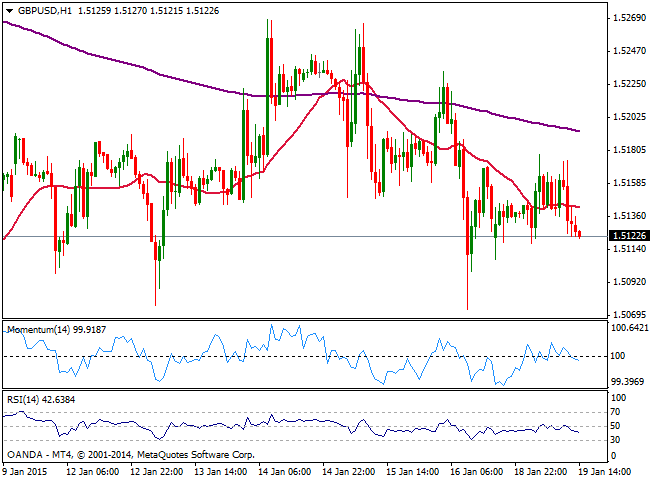
Trading a handful of pips below its daily opening, the GBP/USD pair has been confined to a tight 40 pips range, maintaining the neutral stance seen during the last few sessions. There won’t be much fundamental data coming from the UK until Wednesday, when the kingdom will release the latest BOE Minutes and local employment figures, expected to give clearer clues about upcoming economic policy decisions and therefore GBP direction. From a technical point of view, the short term picture turned slightly bearish as the pair stands below its 20 SMA while indicators aim lower around their midlines. In the 4 hours chart 20 SMA capped the upside earlier on the day, while indicators slowly get into negative territory. A break below 1.5090, strong static support should anticipate more intraday slides towards 1.5033 this month low, while chances of a recovery will increase if the pair advances beyond 1.5180 resistance.
Support levels: 1.5090 1.5050 1.5030
Resistance levels: 1.5140 1.5180 1.5220
USD/JPY Current price: 117.68
View Live Chart for the USD/JPY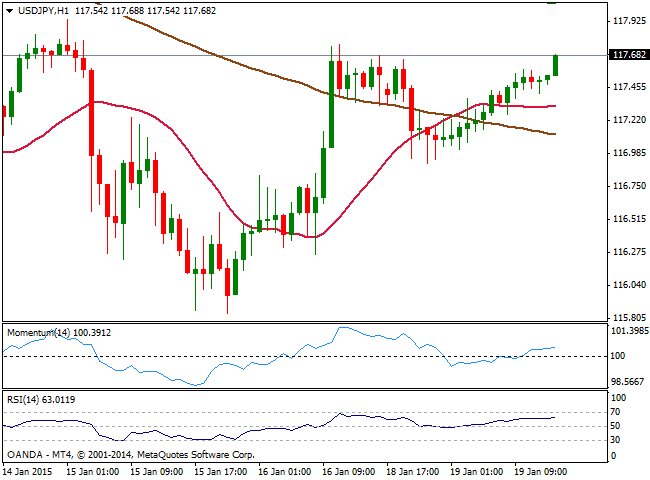
Having been as low as 117.01 early Asia, the USD/JPY erased its intraday losses, up for most of the last two sessions, albeit limited due to the lack of volume as US markets remains closed on Martin Luther King holiday. The USD/JPY pair presents a mild positive tone in the short term, with the 1 hour chart showing price advancing above 20 and 100 SMAs, and indicators holding in positive territory, albeit lacking directional momentum. In the 4 hours chart momentum heads higher above 100 while RSI remains flat around 50, enough at least to limit the downside. Former daily lows around 118.10/20 are now the immediate resistance level to follow, as the price needs to advance above it to extend this recovery towards the 119.00 price zone.
Support levels: 117.35 116.90 116.45
Resistance levels: 117.90 118.20 118.60
AUD/USD Current price: 0.8206
View Live Chart of the AUD/USD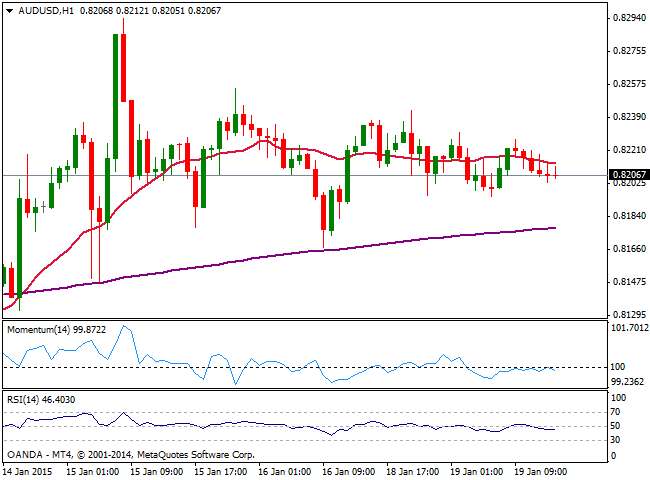
Australian dollar held steady against the greenback, with the pair hovering a few pips above the 0.8200 level for most of the day. Losing a few pips ahead of the Asian opening, Chinese GDP readings will probably be the main market driver in the upcoming hours, and will affect for the most, commodity currencies such as the AUD. Grow is expected to have shrunk in the Q4, down to 1.7% quarterly basis and to 7.2% YoY. If the final readings are even lower, the AUD/USD will probably dip short term, although it will take some follow through below 0.8170 to confirm a steadier decline. Short term, the 1 hour chart shows that the price stands a few pips below a flat 20 SMA while indicators stand horizontal around neutral territory. In the 4 hours chart the price finally broke below its 20 SMA that maintains a bullish slope, while momentum accelerates south below 100, increasing the risk of a short term decline.
Support levels: 0.8170 0.8130 0.8090
Resistance levels: 0.8240 0.8290 0.8330
Recommended Content
Editors’ Picks
EUR/USD holds steady near 1.0650 amid risk reset

EUR/USD is holding onto its recovery mode near 1.0650 in European trading on Friday. A recovery in risk sentiment is helping the pair, as the safe-haven US Dollar pares gains. Earlier today, reports of an Israeli strike inside Iran spooked markets.
GBP/USD recovers toward 1.2450 after UK Retail Sales data

GBP/USD is rebounding toward 1.2450 in early Europe on Friday, having tested 1.2400 after the UK Retail Sales volumes stagnated again in March, The pair recovers in tandem with risk sentiment, as traders take account of the likely Israel's missile strikes on Iran.
Gold: Middle East war fears spark fresh XAU/USD rally, will it sustain?

Gold price is trading close to $2,400 early Friday, reversing from a fresh five-day high reached at $2,418 earlier in the Asian session. Despite the pullback, Gold price remains on track to book the fifth weekly gain in a row.
Bitcoin Price Outlook: All eyes on BTC as CNN calls halving the ‘World Cup for Bitcoin’

Bitcoin price remains the focus of traders and investors ahead of the halving, which is an important event expected to kick off the next bull market. Amid conflicting forecasts from analysts, an international media site has lauded the halving and what it means for the industry.
Geopolitics once again take centre stage, as UK Retail Sales wither

Nearly a week to the day when Iran sent drones and missiles into Israel, Israel has retaliated and sent a missile into Iran. The initial reports caused a large uptick in the oil price.