EUR/USD Current price: 1.2180
View Live Chart for the EUR/USD
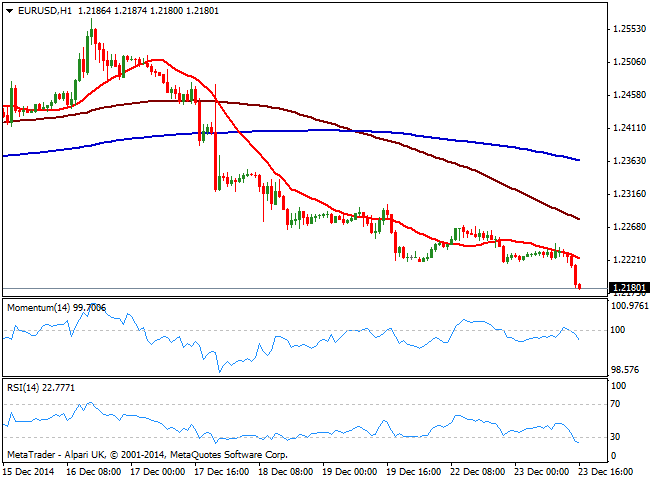
The EUR/USD pair sunk to fresh year lows below 1.2180 on the back of impressive US GDP readings, up to 5% in the final revision of the Q3, the best reading in over a decade. With further US data yet to be released, local indexes futures soared to record highs ahead of the opening, also supporting the dollar’s advance. Overall, the dollar bullish trend remains firms in place despite the low intraday volumes, and the EUR/USD 1 hour chart supports further declines as the price is extending below a bearish 20 SMA and indicators heading south below their midlines. In the 4 hours chart indicators had turned back south deep in negative territory, with RSI extending its decline around 25. Upcoming US housing and consumption readings hold the key to fresh lows, as if the numbers continue to be encouraging, the slide can extend down to 1.2150.
Support levels: 1.2150 1.2120 1.2085
Resistance levels: 1.2220 1.2245 1.2280
GBP/USD Current price: 1.5498
View Live Chart for the GBP/USD
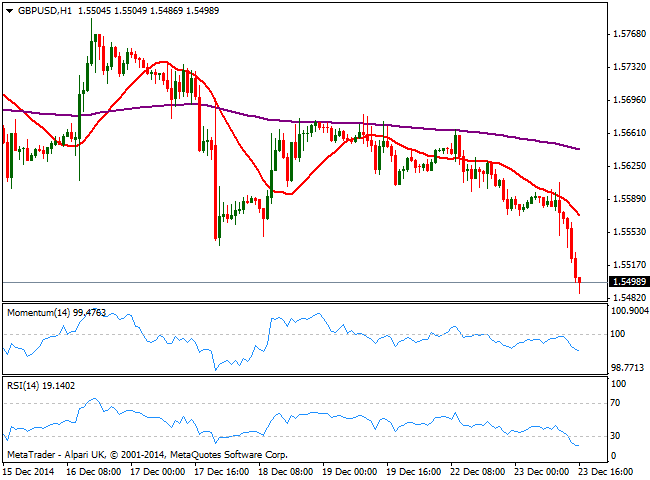
The Cable got a double GDP hit, with the UK release early Europe showing growth shrunk to 2.6% yearly basis and the third quarter GDP printing 0.7%, and USD one rising to an 11-year high of 5%. The pair trades below the 1.5500 level for the first time since August 2013, and the 1 hour chart presents a strong bearish momentum coming from technical readings, with RSI at 18 and 20 SMA accelerating its bearish decline. In the 4 hours chart technical indicators are biased lower deep into negative territory, all of which supports further declines.
Support levels: 1.5585 1.5540 1.5500
Resistance levels: 1.5525 1.5665 1.5700
USD/JPY Current price: 120.72
View Live Chart for the USD/JPY
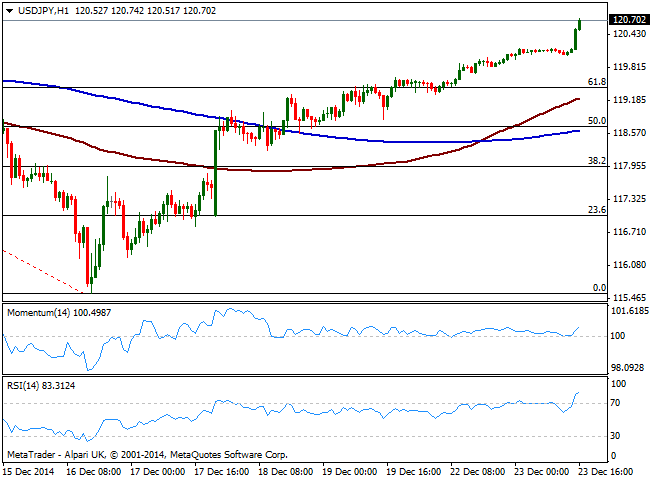
The USD/JPY pair extends its advance after the news, approaching the 121.00 figure first time in 2 weeks. The 1 hour chart shows indicators heading north in positive territory, with 100 SMA extending above 200 one, both below current levels. In the 4 hours chart momentum aims higher above 101 whilst RSI advances above 70, supporting further short term advances, particularly if upcoming US data up beats.
Support levels: 120.45 120.00 119.65
Resistance levels: 120.85 121.10 121.40
AUD/USD Current price: 0.8103
View Live Chart of the AUD/USD
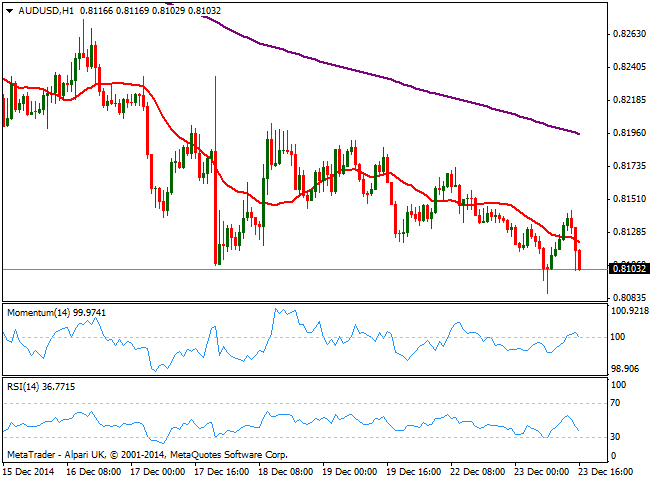
The AUD/USD pressures the 0.8100 level after posting a fresh multiyear low of 0.8087 during the last Asian session. Having found sellers in the 0.8140 price zone, the 1 hour chart shows that the price is developing again below its 20 SMA whilst indicators turned lower, albeit momentum still lacks strength. In the 4 hours chart the pair maintains the bearish tone seen on previous updates, with 20 SMA acting as intraday resistance around mentioned high and indicators heading strongly south in negative territory, supporting further declines.
Support levels: 0.8090 0.8060 0.8025
Resistance levels: 0.8140 0.8170 0.8200
Recommended Content
Editors’ Picks
AUD/USD stands firm above 0.6500 with markets bracing for Aussie PPI, US inflation

The Aussie Dollar begins Friday’s Asian session on the right foot against the Greenback after posting gains of 0.33% on Thursday. The AUD/USD advance was sponsored by a United States report showing the economy is growing below estimates while inflation picked up. The pair traded at 0.6518.
EUR/USD faces a minor resistance near at 1.0750

EUR/USD quickly left behind Wednesday’s small downtick and resumed its uptrend north of 1.0700 the figure, always on the back of the persistent sell-off in the US Dollar ahead of key PCE data on Friday.
Gold holds around $2,330 after dismal US data

Gold fell below $2,320 in the early American session as US yields shot higher after the data showed a significant increase in the US GDP price deflator in Q1. With safe-haven flows dominating the markets, however, XAU/USD reversed its direction and rose above $2,340.
Bitcoin price continues to get rejected from $65K resistance as SEC delays decision on spot BTC ETF options

Bitcoin (BTC) price has markets in disarray, provoking a broader market crash as it slumped to the $62,000 range on Thursday. Meanwhile, reverberations from spot BTC exchange-traded funds (ETFs) continue to influence the market.
US economy: slower growth with stronger inflation

The dollar strengthened, and stocks fell after statistical data from the US. The focus was on the preliminary estimate of GDP for the first quarter. Annualised quarterly growth came in at just 1.6%, down from the 2.5% and 3.4% previously forecast.