EUR/USD Current price: 1.2240
View Live Chart for the EUR/USD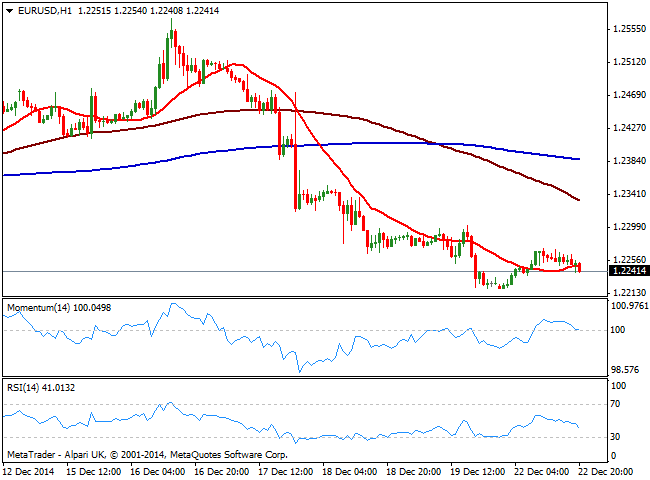
Trading was reduced to its minimum expression during the last two sessions across the forex board, albeit equities enjoyed some limited demand in Europe and America. The EUR/USD pair surged from its year low at 1.2219 to an intraday high of 1.2272, despite the data coming from both sides of the Atlantic resulted disappointing. Early in the day, the German index of import prices decreased by 2.1% in November 2014 compared with the corresponding month of the preceding year. In the US, sales of existing homes unexpectedly fell 6.1%, the weakest reading since May. Furthermore, the EUR was weighted by rumors the ECB will be forced to implement some form of QE in the short term, as local economic conditions continue to deteriorate.
Dollar gathered some limited upward momentum late US session on the back of gold slide that lost over 20 bucks as selling resumed. When it comes to the technical picture, the EUR/USD pair remained limited in a tight intraday range, and the hourly chart shows price around a flat 20 SMA and indicators turning lower around their midlines, showing no directional strength. In the 4 hours chart technical indicators remain in negative territory, while 20 SMA heads lower above current price, offering intraday resistance now around 1.2280.
Support levels: 1.2220 1.2190 1.2160
Resistance levels: 1.2280 1.2310 1.23405
EUR/JPY Current price: 146.80
View Live Chart for the EUR/JPY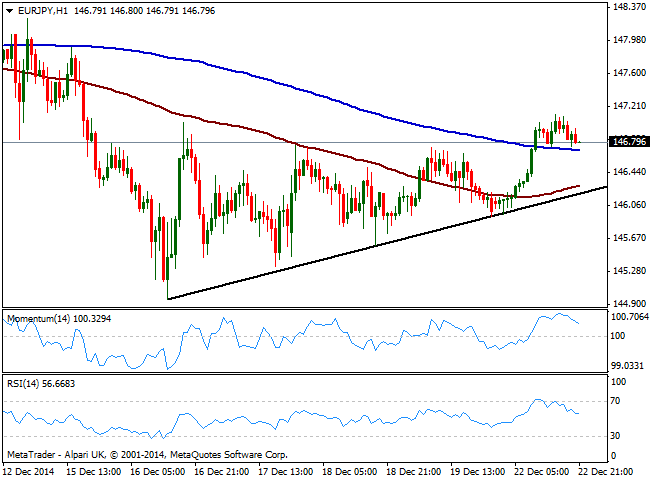
The Japanese yen accelerated its decline against its rivals, and the EUR/JPY cross surged up to an intraday high of 147.11. Trading below the figure by US close, the 1 hour chart shows that indicators are turning lower towards their midline from oversold territory, whilst 200 SMA offers immediate short term support around 146.70. The short term picture presents a mild positive tone, as per price reaching higher highs and finding support in a short term ascendant trend line, today around 146.30. In the 4 hours chart indicators hold above their midlines, but show no aims to run in a certain direction. The 147.00 level has been a tough bone to break lately, and will likely continue to hold in thin market conditions, with only a clear break above 147.30 favoring some upward continuation.
Support levels: 146.60 146.30 145.90
Resistance levels: 146.90 147.30 147.80
GBP/USD Current price: 1.5607
View Live Chart for the GBP/USD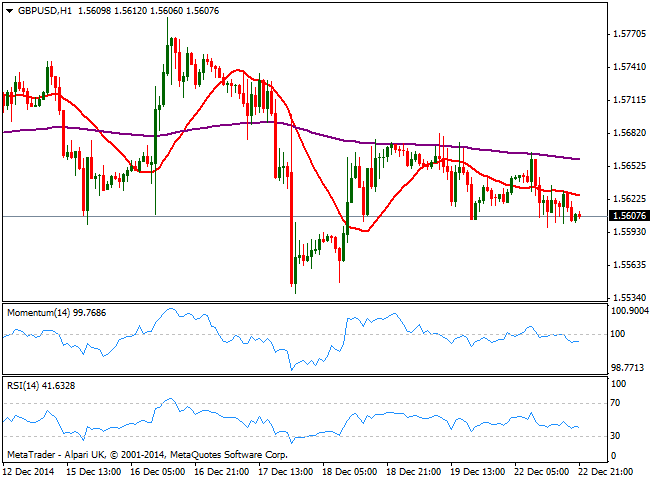
The GBP/USD pair traded as low as 1.5598 this Monday, closing the day barely above the 1.5600 level, overall weighted by dollar demand. There was no fundamental data to affect the Pound, but early Tuesday the UK will release its GDP for the third quarter of 2014. Expectations are below previous quarter readings, meaning a disappointing number can push the pair to fresh year lows below current one at 1.5539. Technically, the short term picture shows that the price has been limited below a bearish 20 SMA, whilst indicators present a slightly bearish slope below their midlines. In the 4 hours chart the technical outlook is also bearish for the pair, with 20 SMA offering immediate intraday resistance in the 1.5620/30 price zone.
Support levels: 1.5590 1.5540 1.5500
Resistance levels: 1.5525 1.5665 1.5700
USD/JPY Current price: 119.92
View Live Chart for the USD/JPY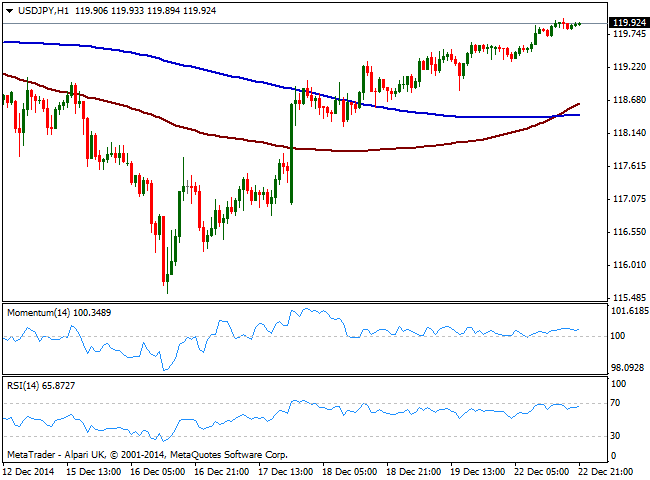
The USD/JPY pair advanced to a fresh 2-week high of 120.01, consolidating a few pips below it for most of the US session. Japan will have a banking holiday this Tuesday which points for limited activity during Asian hours, albeit the JPY maintains a bearish tone. Latest COT report has shown net JPY shorts continued to retreat, reaching its lowest levels in 5 weeks. Nevertheless, the current recovery reinforces the idea of the latest decline being just corrective and due to some profit taking. Technically, the 1 hour chart shows that the 100 SMA crossed above the 200 SMA in the 118.50 area, while indicators hold in positive territory but show no actual strength. In the 4 hours chart technical indicators are losing their upward strength but also hold above their midlines.
Support levels: 119.65 119.30 118.90
Resistance levels: 120.00 120.45 120.85
AUD/USD Current price: 0.8137
View Live Chart of the AUD/USD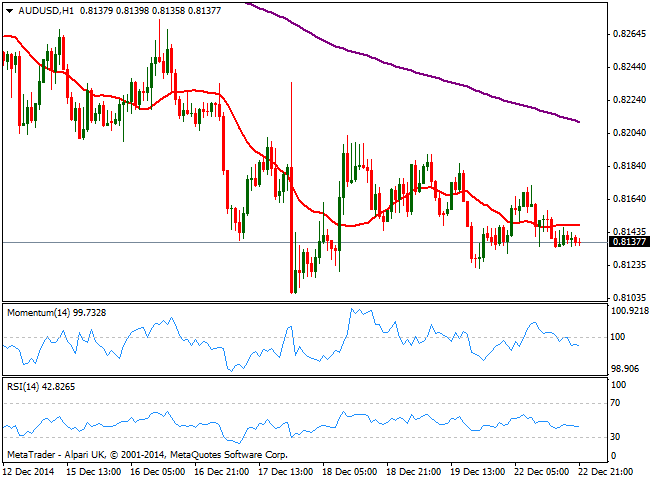
The Australian dollar closed the day pretty much unchanged against the greenback, having been confined to a tight 40 pips range in this first day of the week. The technical downtrend in the AUD/USD pair remains pretty much intact, with scope for a retest of the multiyear high posted last week at 0.8106, the immediate short term support. There will be no relevant data in Australia during the upcoming session which means the pair will likely remain range bound in the shortest term, ahead of US GDP figure late Tuesday, probably the main and last, market mover of the week. Technically, the 1 hour chart shows that the price is developing below its 20 SMA as momentum and RSI regain the downside, extending below their midlines. In the 4 hours chart technical readings are also biased lower supporting the shorter term view.
Support levels: 0.8105 0.8060 0.8025
Resistance levels: 0.8170 0.8200 0.8240
Recommended Content
Editors’ Picks
EUR/USD clings to daily gains above 1.0650

EUR/USD gained traction and turned positive on the day above 1.0650. The improvement seen in risk mood following the earlier flight to safety weighs on the US Dollar ahead of the weekend and helps the pair push higher.
GBP/USD recovers toward 1.2450 after UK Retail Sales data

GBP/USD reversed its direction and advanced to the 1.2450 area after touching a fresh multi-month low below 1.2400 in the Asian session. The positive shift seen in risk mood on easing fears over a deepening Iran-Israel conflict supports the pair.
Gold holds steady at around $2,380 following earlier spike

Gold stabilized near $2,380 after spiking above $2,400 with the immediate reaction to reports of Israel striking Iran. Meanwhile, the pullback seen in the US Treasury bond yields helps XAU/USD hold its ground.
Bitcoin Weekly Forecast: BTC post-halving rally could be partially priced in Premium

Bitcoin price shows no signs of directional bias while it holds above $60,000. The fourth BTC halving is partially priced in, according to Deutsche Bank’s research.
Week ahead – US GDP and BoJ decision on top of next week’s agenda

US GDP, core PCE and PMIs the next tests for the Dollar. Investors await BoJ for guidance about next rate hike. EU and UK PMIs, as well as Australian CPIs also on tap.