EUR/USD Current price: 1.2333
View Live Chart for the EUR/USD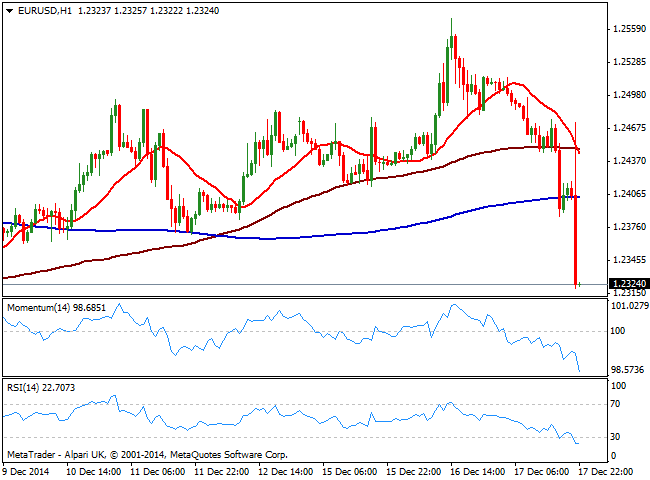
Janet Yellen held her final press conference of the year following the Fed's last policy announcement on Wednesday, after switching “considerable time” for “patient” in the press release. The marked spiked 30 pips both sides of the board back and forth before the press conference, not sure of where to go. But as Yellen kept talking, the picture became more USD bullish, as the FED not only upgraded the assessment of the labor market, but also tiptoed a rate hike for 2015. Following an initial spike to 1.2473, the EUR/USD pair suddenly changed course and dropped to a fresh 7-day high of 1.2320 in less than an hour.
The short term picture shows that the price made a brief spike above a bearish 20 SMA that did not held before moving again well below its 100 and 200 SMAs. Indicators in the same time frame present a strong bearish tone in oversold territory after the 150 pips drop, with no signs of turning north at the time being. In the 4 hours chart the price was also rejected from its 20 SMA whilst indicators present a strong bearish momentum and supporting further declines. The immediate short term resistance stands now at 1.2360, followed by the 1.2400 level, while a break below 1.2310 will likely push the pair to fresh year lows.
Support levels: 1.2310 1.2270 1.2240
Resistance levels: 1.2360 1.2400 1.2445
EUR/JPY Current price: 146.23
View Live Chart for the EUR/JPY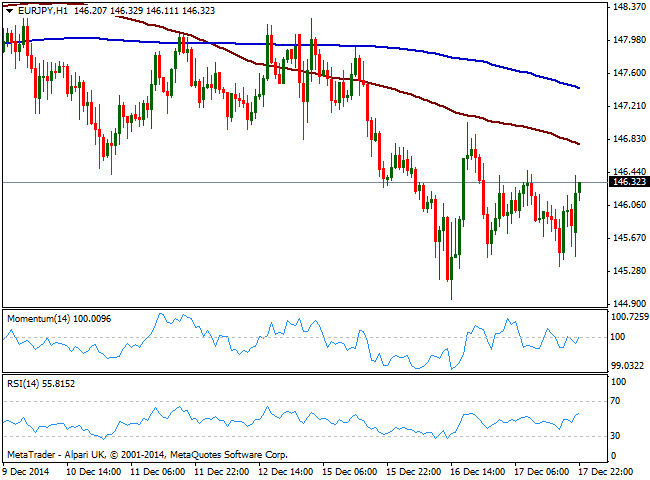
The EUR/JPY cross surged after the news, as yen gets hit by rising stocks and 10Y US yields up to 2.12% in the day. Trading within recent range, the EUR/JPY remains limited as per EUR weakness, with the 1 hour chart showing that the price is still well below its 100 SMA currently offering dynamic resistance at 146.70, while indicators aim slightly higher in neutral territory. In the 4 hours chart indicators bounced from oversold levels but remain well below their midlines and far from anticipating an upward move. Nevertheless, yen gains will likely remain limited with local share markets on the run, with scope to advance up to 147.45 during the upcoming Asian session.
Support levels: 145.90 145.50 145.10
Resistance levels: 146.35 146.80 147.45
GBP/USD Current price: 1.5546
View Live Chart for the GBP/USD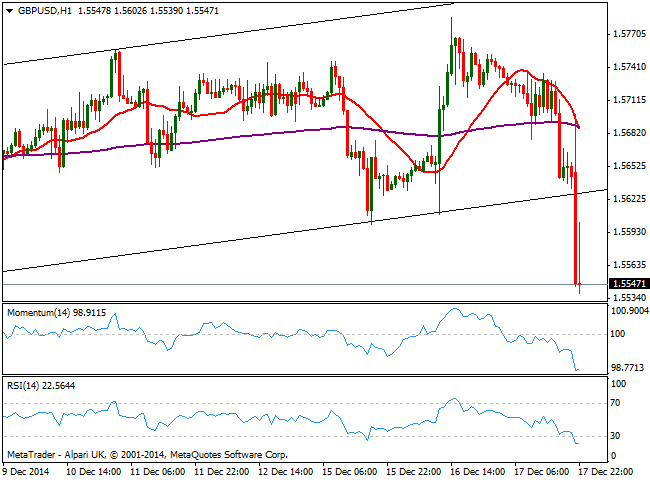
The UK released its latest BOE Minutes and its monthly employment data early European morning, but it seems like it was a century ago. The unemployment rate remained steady at 6.0%, slightly above expectations of a 5.9%, while wages grew more than inflation in October, which is a positive sign for the still struggling economy. Minutes of the latest meeting on the other hand, offer no news as the Central Bank decided to keep its economic policy unchanged and there was no change in the votes either. When it comes to the technical picture, the GBP/USD pair has broken to the downside with the FED’s decision, reaching 1.5539, 1 pip below the year low set earlier this month. In the 1 hour chart indicators halted in extreme oversold levels, but a spike up to 1.5600 quickly reversed suggesting bears remain in control. In the 4 hours chart technical readings are biased lower well into negative territory, supporting further declines if the 1.5540 area finally gives up.
Support levels: 1.5540 1.5490 1.5450
Resistance levels: 1.5590 1.5630 1.5665
USD/JPY Current price: 118.63
View Live Chart for the USD/JPY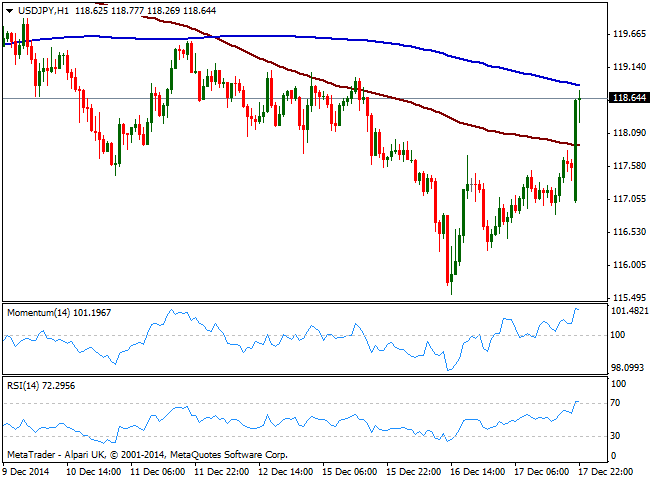
The American dollar finally surged against its Japanese rival, with the USD/JPY pair jumping to 118.78 and erasing these last 2 days losses. The pair recovers alongside with stocks, and seems positioned to continue advancing over Asian hours, as Nikkei futures also trade higher. From a technical point of view, the 1 hour chart shows indicators are losing some of the upward momentum in overbought territory but are far from suggesting a reversal, with price advances towards it 200 SMA, a few pips above the current level and immediate resistance at 118.90. In the 4 hours chart technical readings also present a positive tone, with indicators crossing their midlines to the upside, and supporting the shorter term view, moreover if mentioned resistance is broken.
Support levels: 118.20 117.75 117.30
Resistance levels: 118.90 119.45 119.90
AUD/USD Current price: 0.8125
View Live Chart of the AUD/USD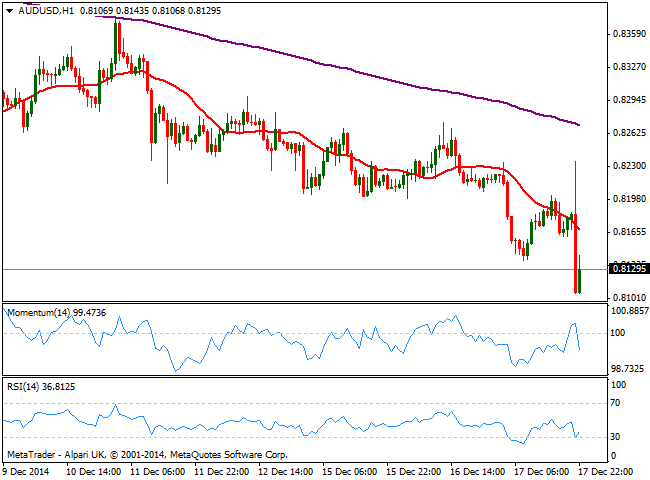
The AUD/USD pair broke below the 0.8200 figure early Wednesday, reaching 0.8138 before bouncing back towards the 0.8200 area. The early move lower was due stops getting triggered below the mentioned level, with no precise catalyst behind it. With the FED, the pair initially surged to 0.8235 before nose-diving to 0.8106, levels not seen since early June 2010. Despite whatever fundamentals may offer, in the particular case of this pair is the dominant bearish long term trend what leads, and selling higher is the name of the game still. In the short term, the 1 hour chart shows 20 SMA extending its decline above current levels whilst momentum heads lower below 100 and RSI bounces from the 30 level up now at 35. In the 4 hours chart indicators maintain their bearish slopes whilst 20 SMA capped the upside now around 0.8215, supporting the shorter term view. A multi-year Fibonacci support is located at 0.7940, 61.8% of the 0.6291/1.107 rally, and seems likely the pair will continue its slide at least towards that level next big bearish target for the upcoming days.
Support levels: 0.8105 0.8060 0.8020
Resistance levels: 0.8140 0.8200 0.8230
Recommended Content
Editors’ Picks
EUR/USD consolidates recovery below 1.0700 amid upbeat mood

EUR/USD is consolidating its recovery but remains below 1.0700 in early Europe on Thursday. The US Dollar holds its corrective decline amid a stabilizing market mood, despite looming Middle East geopolitical risks. Speeches from ECB and Fed officials remain on tap.
GBP/USD advances toward 1.2500 on weaker US Dollar

GBP/USD is extending recovery gains toward 1.2500 in the European morning on Thursday. The pair stays supported by a sustained US Dollar weakness alongside the US Treasury bond yields. Risk appetite also underpins the higher-yielding currency pair. ahead of mid-tier US data and Fedspeak.
Gold appears a ‘buy-the-dips’ trade on simmering Israel-Iran tensions

Gold price attempts another run to reclaim $2,400 amid looming geopolitical risks. US Dollar pulls back with Treasury yields despite hawkish Fedspeak, as risk appetite returns.
Manta Network price braces for volatility as $44 million worth of MANTA is due to flood markets

Manta Network price is defending support at $1.80 as multiple technical indicators flash bearish. 21.67 million MANTA tokens worth $44 million are due to flood markets in a cliff unlock on Thursday.
Have we seen the extent of the Fed rate repricing?

Markets have been mostly consolidating recent moves into Thursday. We’ve seen some profit taking on Dollar longs and renewed demand for US equities into the dip. Whether or not this holds up is a completely different story.