EUR/USD Current price: 1.2725
View Live Chart for the EUR/USD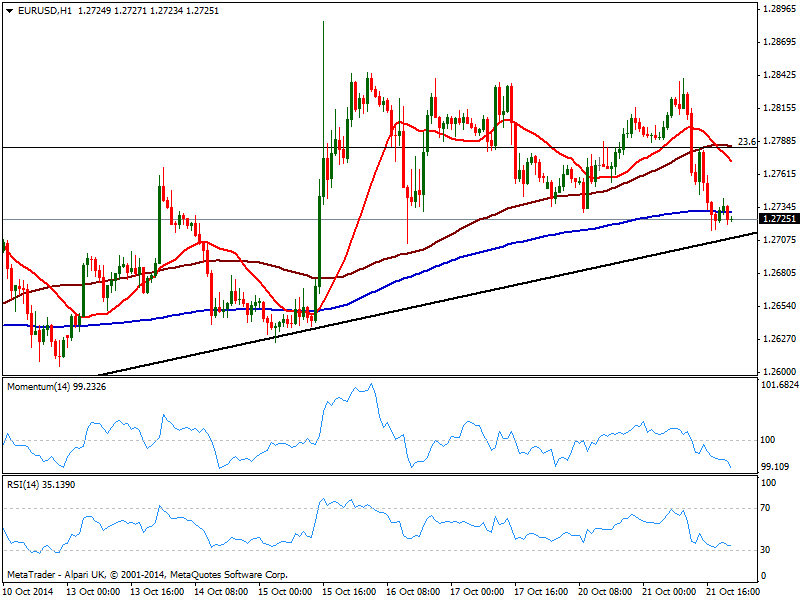
The ECB launched Monday its covered bond purchases, another step to revive the local depressed economy, with a mute market reaction and the news barely hitting the headlines. But mid European morning on Tuesday, some headlines of the ECB being ready to buy bonds from troubled peripheral countries such as Spain and Italy: despite being unfounded rumors and a series of also rumored denials, the EUR/USD sunk setting there the tone for the rest of the day. Local bonds slump along with EUR, while indexes cheered the news, with the main European ones closing average 2.0% up. As for the US, Existing home sales beat expectations, to their highest annual pace of the year, giving dollar another push higher against tumbling Euro. American indexes also benefited, with DJIA up 188 points in the day, and S&P adding 1.78%.
The EUR/USD ended up with a daily low of 1.2716, entering Asian hours a few pips above it. Again, a big technical role was played by the static Fibonacci level around 1.2780, as once broken, sellers decided to add on retests. The 1 hour chart shows price hovering around its 200 SMA, with 20 and 100 ones well above current levels and indicators still heading south near oversold territory. In the 4 hours chart technical readings also present a clear bearish momentum that supports some further declines to be confirmed on a downward acceleration below 1.2700, immediate support as per being a daily ascendant trend line coming from 1.2501 this month low.
Support levels: 1.2700 1.2660 1.2620
Resistance levels: 1.2740 1.2790 1.2845
EUR/JPY Current price: 135.97
View Live Chart for the EUR/JPY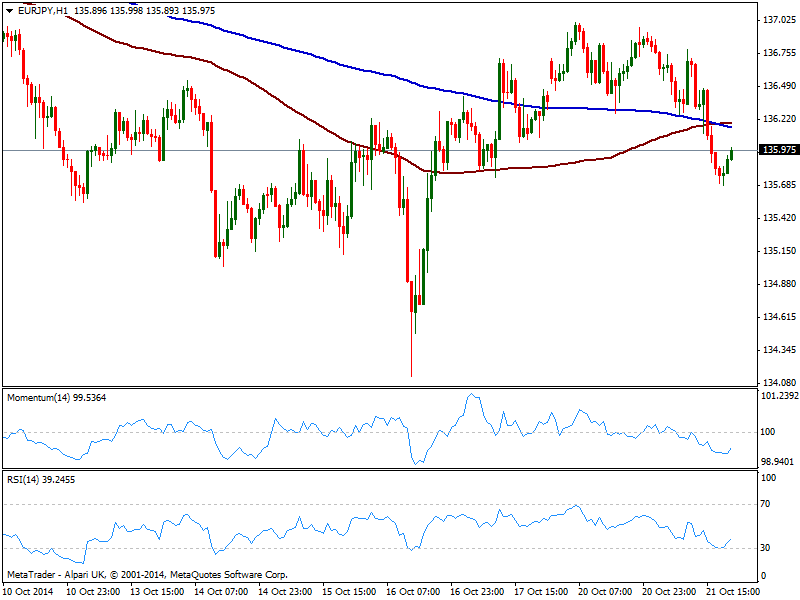
Yen strength was highlighted but latest price behavior, as neither surging stocks nor good US data was enough to push the currency lower against its main rivals. The EUR/JPY extended its decline down to 135.68 with a shallow bounce afterwards being contained by 136.00. Self EUR weakness indeed weighted in the pair, yet further slides may be limited after Nikkei opening, if local share markets decide to copycat their American rivals. Short term, the 1 hour chart shows price developing below 100 an 200 SMAs both together around 136.20: despite below them, the fact that they converge in a level usually signals lack of directional strength, which requires some downward extension in price now to confirm a continued decline. Indicators in the same time frame are bouncing from oversold territory, still far from their midlines. In the 4 hours chart a strong bearish momentum prevails, supporting the shorter term view: break through 135.50 should then lead to further intraday declines with next short term support at 135.05.
Support levels: 135.50 35.05 134.70
Resistance levels: 136.60 137.05 137.45
GBP/USD Current price: 1.6117
View Live Chart for the GBP/USD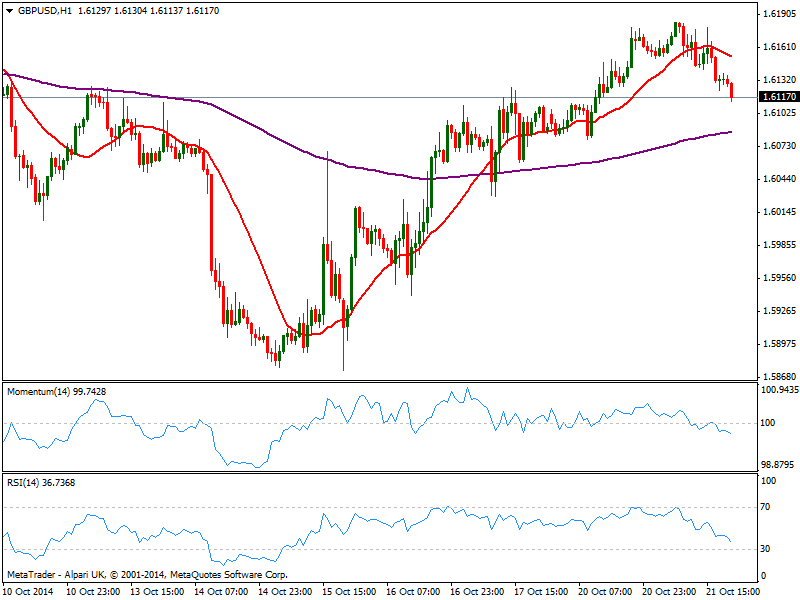
Pound topped at 1.6184 against the greenback where it began a slow but steady decline, extending now below 1.6125, anticipating more slides ahead. The pair will have to face BOE Minutes over upcoming European session, which may restrict movements over Asian hours. In the meantime, the 1 hour chart shows price extending below 20 SMA that slowly turns south, as indicators advance below their midlines. In the 4 hours chart indicators approach their midlines from above with a strong bearish slope, as rice struggles around a bullish 20 SMA. A price acceleration through 1.6100 should open doors for a continued decline towards 1.6060, while some advances above 1.6125 will reduce bear’s opportunities in the short term.
Support levels: 1.6090 1.6060 1.6030
Resistance levels: 1.6125 1.6185 1.6220
USD/JPY Current price: 106.83
View Live Chart for the USD/JPY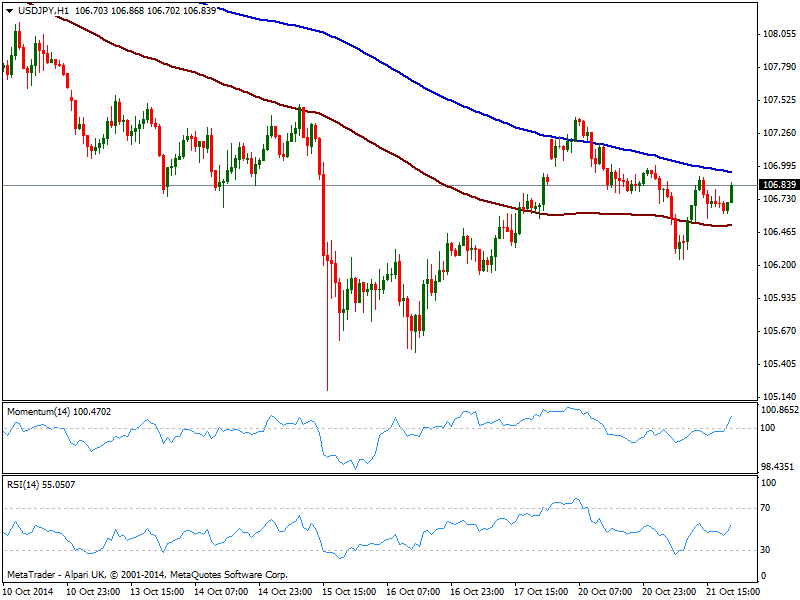
The USD/JPY maintains a tight intraday range, unable to regain the 107.00 over these last sessions, and having established a lower low daily basis at 106.25, all of which reflects sellers are still on the drivers’ seat. The short term picture shows price moving back and forth between 200 SMA at 107.00 and 100 SMA at 106.50, this last immediate support. Indicators stand above their midlines but showing no upward strength, while the 4 hours chart shows indicators holding in neutral territory, and moving averages well above current price. Overall, technical picture is neutral, and either some follow through above 107.35 of below 106.30 is now required to confirm some directional strength.
Support levels: 106.60 106.30 106.05
Resistance levels: 107.05 107.35 107.60
AUD/USD Current price: 0.8777
View Live Chart of the AUD/USD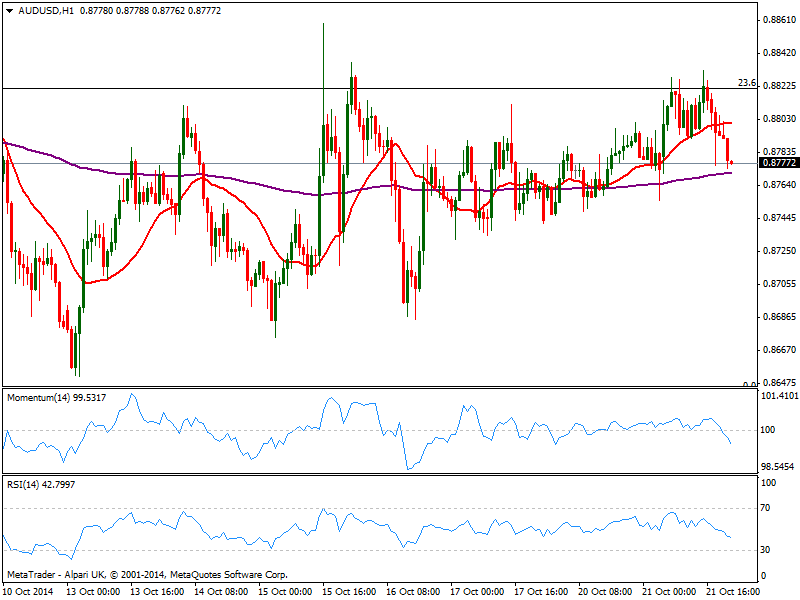
Once again, AUD/USD advances failed to overcome selling interest aligned at 0.8820 and retraced from its overnight high. Despite trading inside in its usual range, the pair seems to have established a new one in the upper high of the widest between 0.8640 and 0.8820, now finding short term buyers on approaches to 0.8730. Australia will release its monthly inflation numbers over upcoming Asian hours, and those will probably set the tone for the pair. In the short term, the 1 hour chart shows a mild bearish tone as indicators enter negative territory, while price develops below a flat 20 SMA. In the 4 hours chart technical readings remain firmly neutral; short term levels to watch before upcoming news are then now 0.8820 to the upside, and mentioned 0.8730 to the downside.
Support levels: 0.8770 0.8730 0.8690
Resistance levels: 0.8820 0.8860 0.8900
Recommended Content
Editors’ Picks
AUD/USD remained bid above 0.6500

AUD/USD extended further its bullish performance, advancing for the fourth session in a row on Thursday, although a sustainable breakout of the key 200-day SMA at 0.6526 still remain elusive.
EUR/USD faces a minor resistance near at 1.0750

EUR/USD quickly left behind Wednesday’s small downtick and resumed its uptrend north of 1.0700 the figure, always on the back of the persistent sell-off in the US Dollar ahead of key PCE data on Friday.
Gold holds around $2,330 after dismal US data

Gold fell below $2,320 in the early American session as US yields shot higher after the data showed a significant increase in the US GDP price deflator in Q1. With safe-haven flows dominating the markets, however, XAU/USD reversed its direction and rose above $2,340.
Bitcoin price continues to get rejected from $65K resistance as SEC delays decision on spot BTC ETF options

Bitcoin (BTC) price has markets in disarray, provoking a broader market crash as it slumped to the $62,000 range on Thursday. Meanwhile, reverberations from spot BTC exchange-traded funds (ETFs) continue to influence the market.
US economy: slower growth with stronger inflation

The dollar strengthened, and stocks fell after statistical data from the US. The focus was on the preliminary estimate of GDP for the first quarter. Annualised quarterly growth came in at just 1.6%, down from the 2.5% and 3.4% previously forecast.