EUR/USD Current price: 1.2819
View Live Chart for the EUR/USD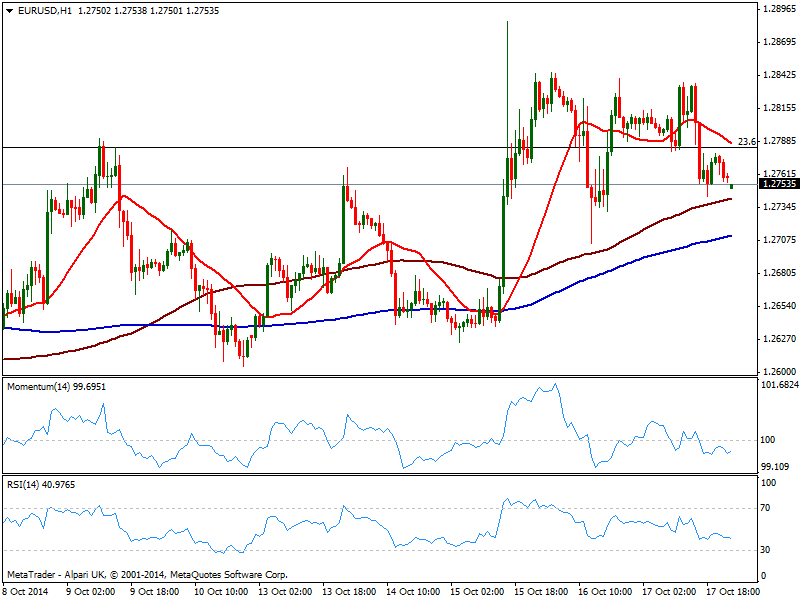
Despite two weeks in a row of steady gains and a few spikes above 1.2780 price zone, the EUR/USD continues to trade below the key level, 23.6% retracement of its 1.37/1.25 slide. Panic selling among stocks was the main market leader last week, and Friday limited relief gains had not yet pushed away the ghost of further falls: US indexes had been an a steady decline for already 4 weeks, erasing most of this year gains in a bit less than a month. Some FED’s officers jawboning on a possible extension in the life of QE, last 15B expected to be trimmed this month, has also had to do with stocks halting the bleeding, yet if the US Central Bank proceeds, the selloff should resume.
As for the EUR/USD, the short term technical picture shows EUR gapping lower against most rivals, still showing self weakness. The 1 hour chart for the pair shows 20 SMA heading lower above current price while indicators present a mild bearish tone below their midlines. In the same time frame 100 SMA offers short term support around 1.2740 converging with Friday’s low, so a price acceleration below it should increase the downward risk. In the 4 hours chart week starts with a candle opening below a bullish 20 SMA as indicators turn strongly south an approaching their midlines still in positive territory, supporting the concept of some downward acceleration before confirming a bearish run. Above 1.2790 on the other hand should favor some short term gains, with a break above 1.2845 required then to talk about further EUR gains.
Support levels: 1.2740 1.2700 1.2660
Resistance levels: 1.2790 1.2845 1.2890
EUR/JPY Current price: 136.59
View Live Chart for the EUR/JPY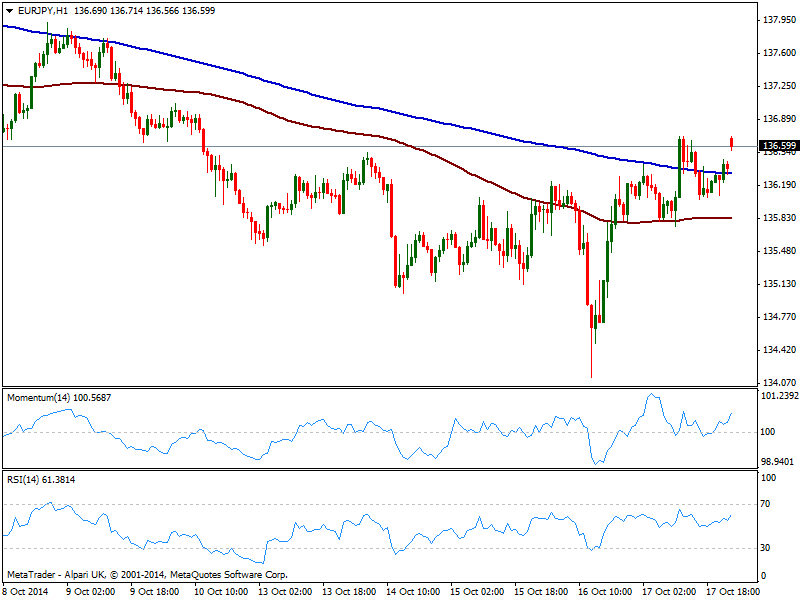
Week starts with some local political jitters in Japan, as Yuko Obuchi, Japan’s Minister of Economy, Trade and Industry presents is reportedly said to have presented her resign on reports of misuse of funds, and PM Shinzo Abe has the last word on the matter. Yen has shed some of its recent strength by the ends of last week, but maintains most of its month gains against its major rivals. However, the Japanese currency opens with a weak tone and the EUR/JPY gaps higher, pressuring Friday’s high of 136.71. In the meantime, the 1 hour chart shows 100 and 200 SMAs flat with the shortest below the largest, which means bulls are not yet in full control. Indicators in the same time frame head higher above their midlines, while the 4 hours chart shows also some upward momentum coming from technical readings, yet moving averages well above current price. All in one, further recoveries will depend on rising stocks and the ability of the pair to establish itself above 137.90, the line in the sand for current bearish trend.
Support levels: 136.30 135.80 135.50
Resistance levels: 136.70 137.45 137.90
GBP/USD Current price: 1.6098
View Live Chart for the GBP/USD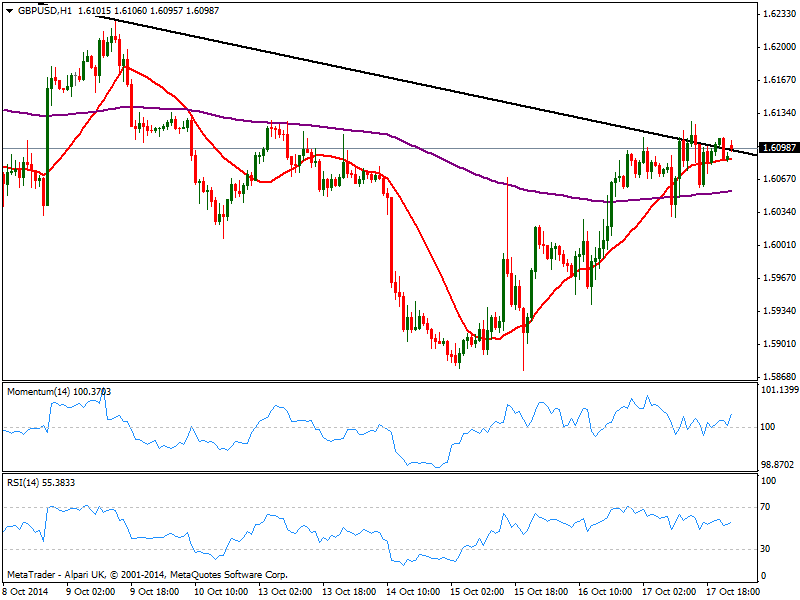
Pound recovery against the greenback is being halted so far by a daily descendant trend line coming from 1.6523 past September 19th daily high. Some shy attempts to breach above the level have been reversed, but price pressuring nearby suggest an imminent break higher. Nevertheless, recent data pointing for cooling economic growth has limited chances of a steadier advance, as per diminishing chances of a rake hike in the UK. BOE Minutes to be release next Wednesday may be the make it or break on the matter, as if votes shift back to 9-0-0, Pound may suffer big. Short term, the hourly chart shows price still moving back and forth around the descendant trend line, with indicators for the most neutral, lacking directional strength at the time being. In the 4 hours chart indicators turned south above their midlines, while 20 SMA aims slightly up, well below current price. Some recent highs in the 1.6125 price zone offer immediate short term resistance, and some steady advances above the level should anticipate a firmer bullish intraday pace for this Monday.
Support levels: 1.6060 1.6020 1.5970
Resistance levels: 1.6125 1.6150 1.6190
USD/JPY Current price: 107.10
View Live Chart for the USD/JPY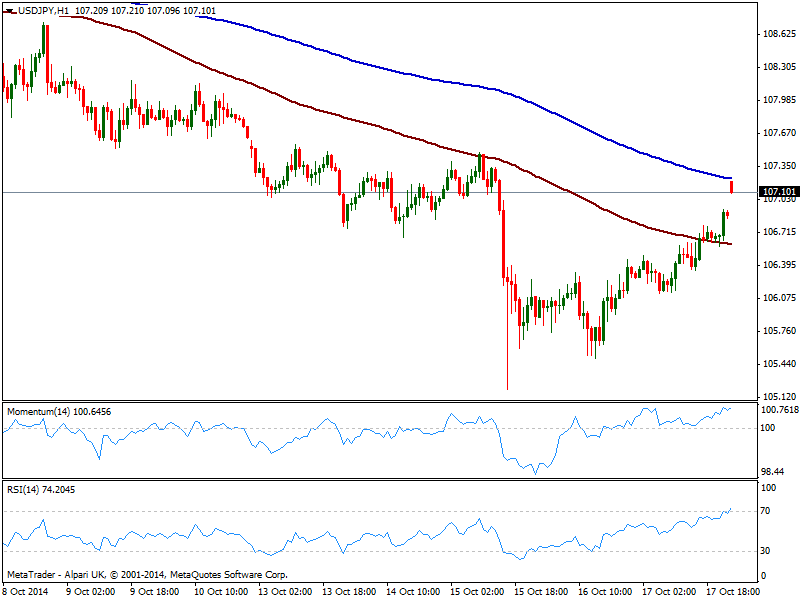
The USD/JPY surges in the opening, regaining briefly the 107.00 level, and with the short term picture showing 200 SMA acting as short term resistance around 107.25, while 100one offers support now around 106.40. Indicators in the same time frame stand above their midlines, albeit lacking strength at the time being, while the 4 hours chart shows a strong upward momentum coming from technical readings, yet price still below its moving averages. As it has been usual lately, yen movements will remain linked to stocks volatility and would take a recovery beyond 108.30/40 price zone, to see it resuming the upward strength from last September.
Support levels: 106.70 106.40 106.10
Resistance levels: 107.25 107.60 108.00
AUD/USD Current price: 0.8757
View Live Chart of the AUD/USD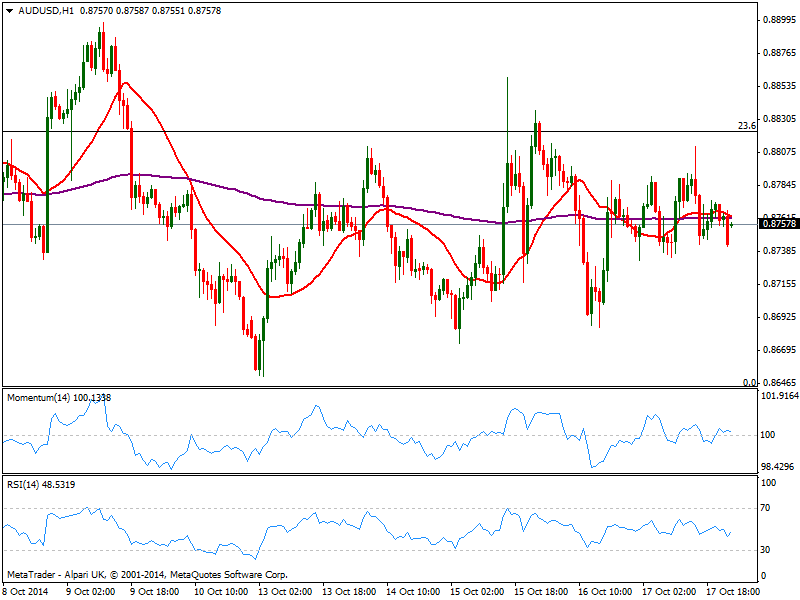
A hurdle of data coming from China and Australia this week, including local CPI readings and several speeches from RBA members, may finally push AUD/USD outside its comfort zone, as the pair has been trading pretty much in a 200 pips range for nearly one month already, between 0.8640 and 0.8820. Starting the week midrange, the 1 hour chart shows price a few pips below both flat 20 SMA and 200 EMA, and indicators steady in neutral territory, a clear reflection of the lack of directional strength. In the 4 hours chart 20 SMA also stands horizontal while indicators stand around their midlines, neither offering a clear picture of what’s next for the pair.
Support levels: 0.8730 0.8690 0.8640
Resistance levels: 0.8770 0.8820 0.8860
Recommended Content
Editors’ Picks
EUR/USD climbs to 10-day highs above 1.0700

EUR/USD gained traction and rose to its highest level in over a week above 1.0700 in the American session on Tuesday. The renewed US Dollar weakness following the disappointing PMI data helps the pair stretch higher.
GBP/USD extends recovery beyond 1.2400 on broad USD weakness

GBP/USD gathered bullish momentum and extended its daily rebound toward 1.2450 in the second half of the day. The US Dollar came under heavy selling pressure after weaker-than-forecast PMI data and fueled the pair's rally.
Gold rebounds to $2,320 as US yields turn south

Gold reversed its direction and rose to the $2,320 area, erasing a large portion of its daily losses in the process. The benchmark 10-year US Treasury bond yield stays in the red below 4.6% following the weak US PMI data and supports XAU/USD.
Here’s why Ondo price hit new ATH amid bearish market outlook Premium

Ondo price shows no signs of slowing down after setting up an all-time high (ATH) at $1.05 on March 31. This development is likely to be followed by a correction and ATH but not necessarily in that order.
Germany’s economic come back

Germany is the sick man of Europe no more. Thanks to its service sector, it now appears that it will exit recession, and the economic future could be bright. The PMI data for April surprised on the upside for Germany, led by the service sector.