EUR/USD Current price: 1.2775
View Live Chart for the EUR/USD
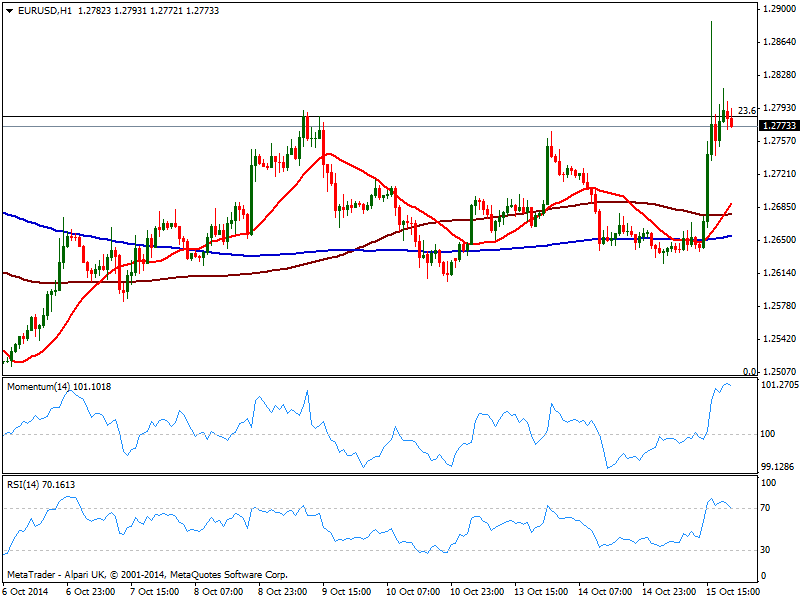
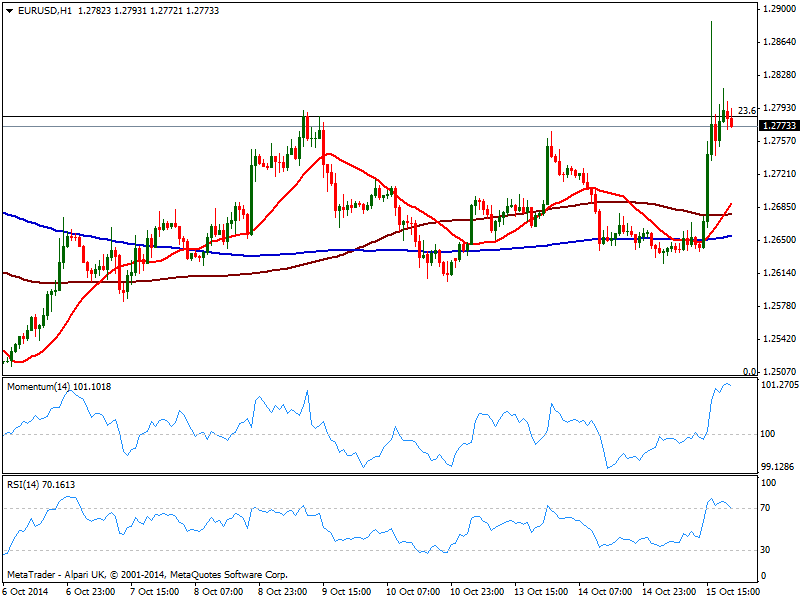
It was another hard day for stocks traders: the DJIA plunged as much as 490 points before pulling back to end the day around 320 points down, while the S&P lost over 2.0% on the day. Furthermore, both indexes ended the day a few points below the 61.8% retracement of this year rally, something that the market won’t resole easily: panic is here to stay. US data coming out before the opening bell resulted quite disappointing, with NY manufacturing index, Retail Sales and PPI missing expectations, igniting dollar selloff, early US session: the EUR/USD jumped to post a 3-week high of 1.2886 before pulling back.
Technically, the pair entered in a consolidative stage around the critical Fibonacci resistance of 1.2780, with the 1 hour chart sowing indicators still in overbought territory, turning however lower. Moving averages in the same time frame remain revolted in a tight range well below current price due to latest lack of direction, being no help at the time being. In the 4 hours chart price points to close the day above its 20 SMA that anyway remains flat, while momentum maintains a strong bullish slope, pointing for some further advances particularly if the pair manages to regain the 1.2810 level.
Support levels: 1.2745 1.2700 1.2660
Resistance levels: 1.2845 1.2890 1.2930
EUR/JPY Current price: 135.50
View Live Chart for the EUR/JPY
Both, EUR and JPY had been the major losses in these last months dollar’s run according to COT reports, so is no big shock seen both running even against its American rival, leaving the EUR/JPY range bound. But with stocks smashed and US Yields down to 2.09%, the yen has more chances to surge victorious. As for the short term, the 1 hour chart shows recovery attempts were halted below a still bearish 100 SMA, as indicators hold below their midlines, showing no directional strength. He pair stands close to its recent low of 135.03, still the level to break to confirm further declines. In the 4 hours chart 100 SMA crossed below 200 one week above current price first time in 2 month, while indicators head lower below their midlines, supporting the dominant bearish tone.
Support levels: 134.90 134.50 134.00
Resistance levels: 135.90 136.55 137.10
GBP/USD Current price: 1.5925
View Live Chart for the GBP/USD
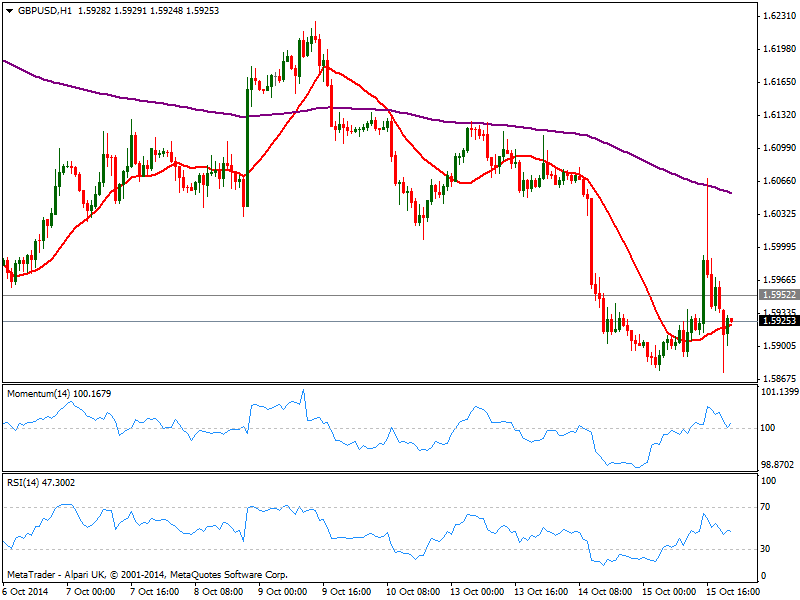
There was a wild ride in the GBP/USD too, but the pair ended the day with quite limited gains, as market has largely overreacted to weak US numbers that in no way signal an economic slowdown in the country. Earlier on the day, UK employment figures resulted so-so, with wages slightly up and unemployment down to 6.0%, but the market held any reaction until US numbers. The pair reached a daily high of 1.6068 before shedding its gains and quite significant, closing it below the 1.5950 level. The 1 hour chat shows indicators bouncing some from their midlines and price above a bullish 20 SMA, none of them showing directional strength. In the 4 hours chart indicators barely corrected oversold readings before turning back south below their midlines, while 20 SMA maintains its bullish slope above current price. Another slide below 1.5890 should increase the risk of a stronger decline, eyeing 1.5770 strong midterm support for the upcoming days.
Support levels: 1.5890 1.5850 1.5810
Resistance levels: 1.5950 1.5990 1.6020
USD/JPY Current price: 106.11
View Live Chart for the USD/JPY
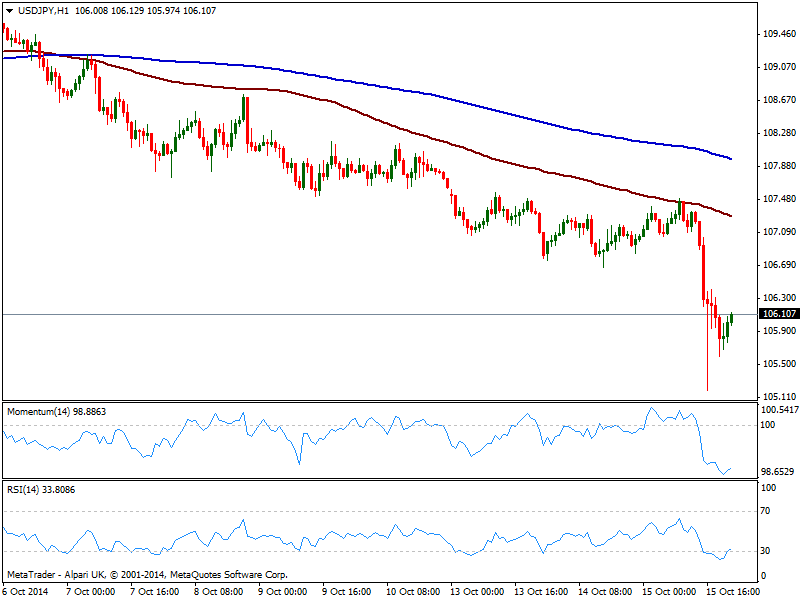
The USD/JPY fall as low as 105.19 intraday, recovering finally above the 106.00 figure where it stands. Nevertheless, yen strength is undeniable, and former low around 106.60 are the level to watch over the upcoming sessions, as as long as below, risk remains to the downside. The 1 hour chart shows 100 SMA contained the upside earlier on the day, currently around 107.30, while indicators slowly turn higher in oversold levels. In the 4 hours chart, indicators also aim for a correction higher, but remain well below their midlines suggesting limited advances in the short term. A price acceleration below 106.00 on the other hand, will deny the possibility of such correction, and put the pair back on the bearish track towards the 105.20/40 price zone.
Support levels: 106.00 105.70 105.30
Resistance levels: 106.30 106.60 107.20
AUD/USD Current price: 0.8780
View Live Chart of the AUD/USD
The AUD/USD has been quite choppy lately, and Wednesday was no exception: the dollar turn south helped the pair reach 0.8860 before pulling quickly back below critical 0.8820 price zone, ending the day with some gains but still unable to set a longer term direction. In the 1 hour chart, price stands above a bullish 20 SMA that attracted buyers earlier on the day, now around 0.8730, while indicators bounced from their midlines and maintain a bullish slope supporting some advance towards mentioned critical resistance. The 4 hours chart shows indicators still flat yet in positive territory, while 20 SMA gains a shy bullish slope below current price. Some firm consolidation and continuation either above 0.8820 or below 0.8640 is required to set direction: in the meantime, that’s the range to play.
Support levels: 0.8770 0.8730 0.8690
Resistance levels: 0.8820 0.8850 0.8880
Recommended Content
Editors’ Picks
EUR/USD fluctuates near 1.0700 after US data

EUR/USD stays in a consolidation phase at around 1.0700 in the American session on Wednesday. The data from the US showed a strong increase in Durable Goods Orders, supporting the USD and making it difficult for the pair to gain traction.
USD/JPY refreshes 34-year high, attacks 155.00 as intervention risks loom

USD/JPY is renewing a multi-decade high, closing in on 155.00. Traders turn cautious on heightened risks of Japan's FX intervention. Broad US Dollar rebound aids the upside in the major. US Durable Goods data are next on tap.
Gold keeps consolidating ahead of US first-tier figures

Gold finds it difficult to stage a rebound midweek following Monday's sharp decline but manages to hold above $2,300. The benchmark 10-year US Treasury bond yield stays in the green above 4.6% after US data, not allowing the pair to turn north.
Worldcoin looks set for comeback despite Nvidia’s 22% crash Premium

Worldcoin price is in a better position than last week's and shows signs of a potential comeback. This development occurs amid the sharp decline in the valuation of the popular GPU manufacturer Nvidia.
Three fundamentals for the week: US GDP, BoJ and the Fed's favorite inflation gauge stand out Premium

While it is hard to predict when geopolitical news erupts, the level of tension is lower – allowing for key data to have its say. This week's US figures are set to shape the Federal Reserve's decision next week – and the Bank of Japan may struggle to halt the Yen's deterioration.