EUR/USD Current price: 1.2601
View Live Chart for the EUR/USD
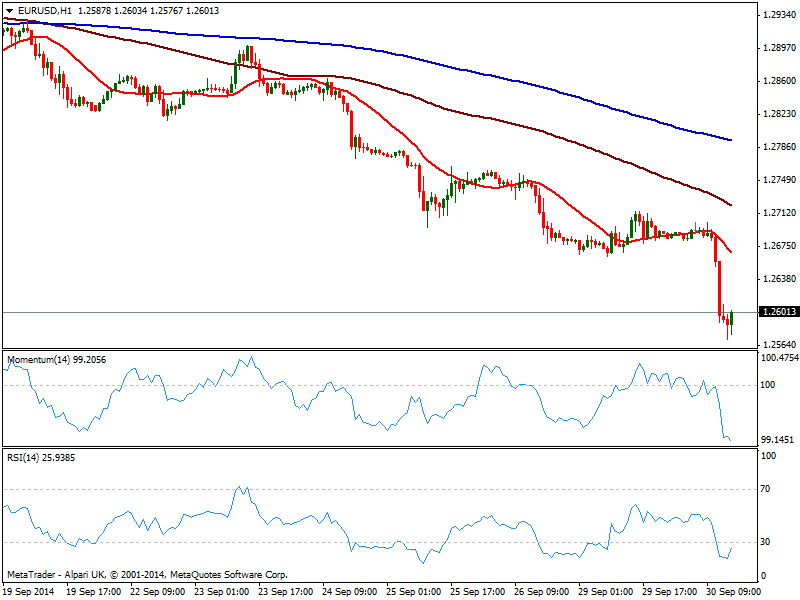
The EUR/USD traded as low as 1.2570 this Tuesday with the downward pressure seeing no end: the pair break to fresh year lows even before EZ CPI data was released, showing deflation has become a real threat for Europe, with inflation at 5 years lows. The pair has reached extreme oversold readings in the hourly chart and bounced some, hovering around the 1.2600 figure early US session, still quite heavy according to technical readings, as per 20 SMA heading lower well above current price, momentum heading strongly south deep in negative territory, and RSI still at 23. In the 4 hours chart 20 SMA capped the upside earlier on the day maintaining a strong bearish slope, while indicators head strongly south in negative territory, giving no signs of a possible upward correction. Former low at 1.2660 should now attract sellers if reached, while a break below mentioned low should see the pair extending its decline down to 1.2540/50 price zone.
Support levels: 1.2570 1.2540 1.2510
Resistance levels: 1.2620 1.2660 1.2700
GBP/USD Current price: 1.6214
View Live Chart for the GBP/USD
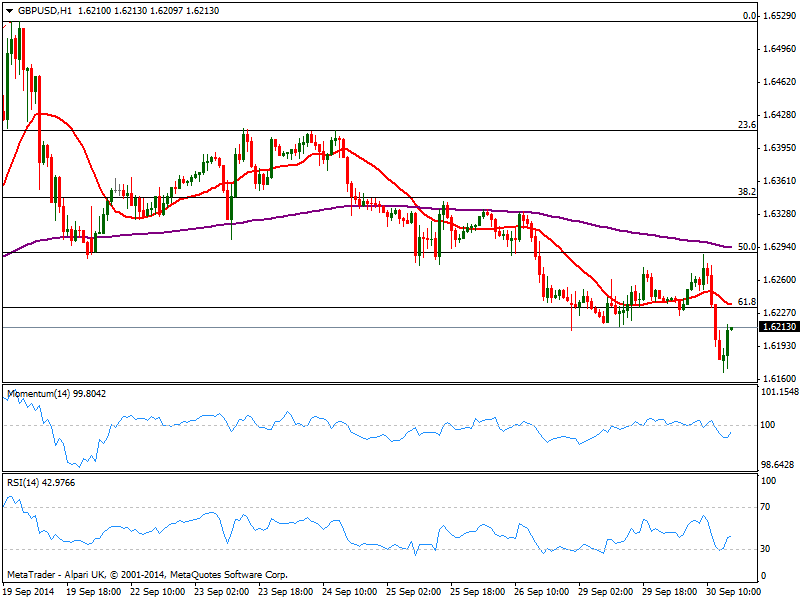
Pound was unable to grab steam from a better than expected GDP reading in the UK, falling along with EUR against the greenback. The GBP/USD traded as low as 1.6166, from where it’s currently recovering some, still below the 61.8% retracement of the latest daily bullish run. The 1 hour chart shows 20 SMA converging with the mentioned Fibonacci level around 1.6235, while indicators head higher still below their midlines. In the 4 hours chart technical readings maintain a strong bearish tone, and as long as below mentioned resistance the downside is favored with a break below 1.6160 favoring an approach to the 1.6100 figure.
Support levels: 1.6160 1.6120 1.6085
Resistance levels: 1.6235 1.6260 1.6290
USD/JPY Current price: 109.72
View Live Chart for the USD/JPY
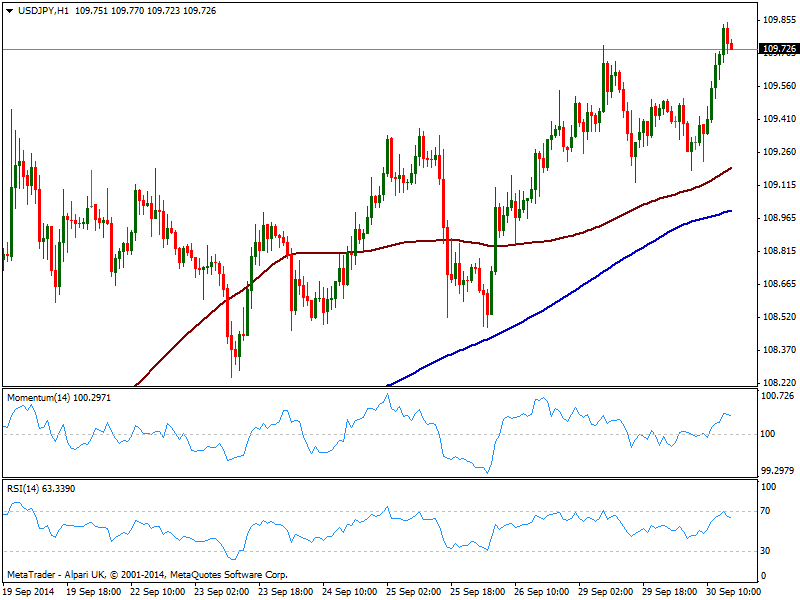
Dollar momentum saw USD/JPY reached yet another high for the year at 109.84, with the pair trading a few pips below it. The 1 hour chart shows price well above 100 and 200 SMAs both maintaining a shy bullish slope, while indicators eased some from overbought territory. In the 4 hours chart indicators also turned lower but hold well above their midlines, showing no actual upward strength, neither signs of a retracement. The dominant bullish trend prevails regardless mild positive technical readings, and retracements are still seen as buying opportunities now on approaches to the 109.00 price zone.
Support levels: 109.45 109.15 108.90
Resistance levels: 109.80 110.20 110.50
AUD/USD Current price: 0.8732
View Live Chart of the AUD/USD
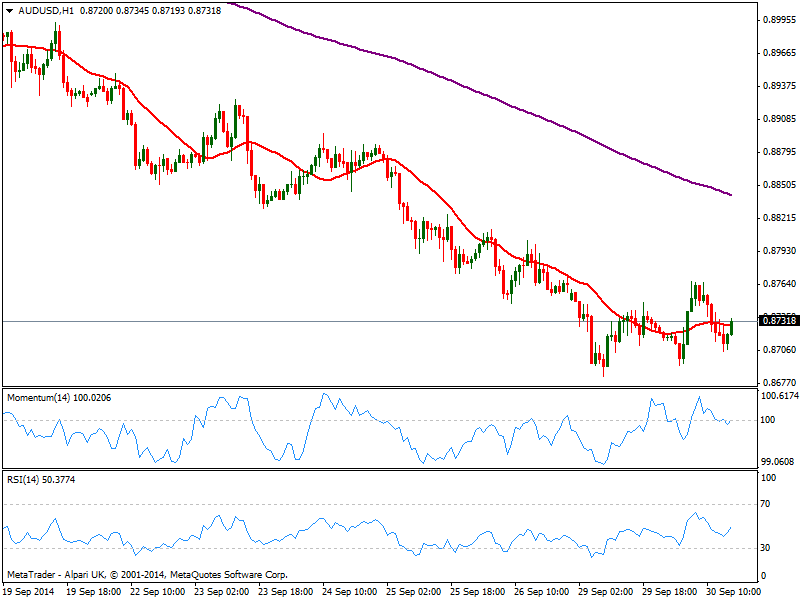
Australian dollar consolidates near its lows against the greenback, with the pair so far posting a higher low and a higher range daily basis, but holding within early week range. The 1 hour chart shows price trying to advance above a flat 20 SMA and indicators directionless around their midlines. In the 4 hours chart price remains below a bearish 20 SMA currently around 0.8750, while indicators aim higher below their midlines. Overall, the pressure remains to the downside, yet a break below 0.8680 is required to confirm a new leg lower.
Support levels: 0.8710 0.8680 0.8635
Resistance levels: 0.8750 0.8800 0.8840
Recommended Content
Editors’ Picks
EUR/USD regains traction, recovers above 1.0700

EUR/USD regained its traction and turned positive on the day above 1.0700 in the American session. The US Dollar struggles to preserve its strength after the data from the US showed that the economy grew at a softer pace than expected in Q1.
GBP/USD returns to 1.2500 area in volatile session

GBP/USD reversed its direction and recovered to 1.2500 after falling to the 1.2450 area earlier in the day. Although markets remain risk-averse, the US Dollar struggles to find demand following the disappointing GDP data.
Gold climbs above $2,340 following earlier drop

Gold fell below $2,320 in the early American session as US yields shot higher after the data showed a significant increase in the US GDP price deflator in Q1. With safe-haven flows dominating the markets, however, XAU/USD reversed its direction and rose above $2,340.
XRP extends its decline, crypto experts comment on Ripple stablecoin and benefits for XRP Ledger

Ripple extends decline to $0.52 on Thursday, wipes out weekly gains. Crypto expert asks Ripple CTO how the stablecoin will benefit the XRP Ledger and native token XRP.
After the US close, it’s the Tokyo CPI

After the US close, it’s the Tokyo CPI, a reliable indicator of the national number and then the BoJ policy announcement. Tokyo CPI ex food and energy in Japan was a rise to 2.90% in March from 2.50%.