EUR/USD Current price: 1.2712
View Live Chart for the EUR/USD
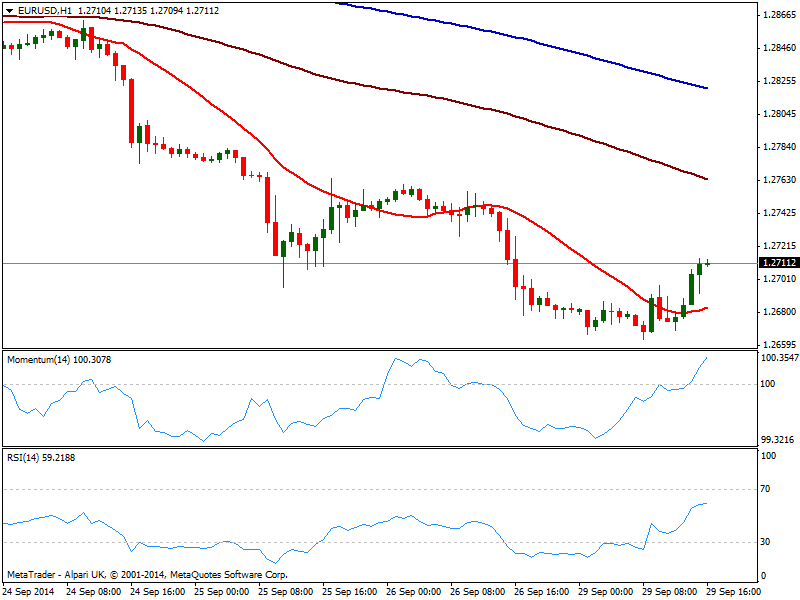
Dollar eases along with stocks ahead of US opening, with the EUR/USD bouncing up to current daily highs. Early data show German inflation data come out in line with previous month readings, slightly above expected. In the US front, Personal consumption data result a bit better than expected, with Core reading steady at 1.5% against an expected drop to 1.4%. Greenback remains under pressure in the short term, as local share markets point to open with strong losses. Technically, the 1 hour chart shows price advancing above a flat 20 SMA with momentum heading higher above 100 and RSI also in positive territory. In the 4 hours chart RSI barely corrected oversold readings, while momentum stands below 100 and 20 SMA heads lower above current price. The bounce can extend as high as 1.2760/70 price zone, moreover if stocks enter selloff mode, yet further advances seem unlikely for these first days of the week.
Support levels: 1.2660 1.2625 1.2590
Resistance levels: 1.2715 1.2740 1.2770
GBP/USD Current price: 1.6253
View Live Chart for the GBP/USD
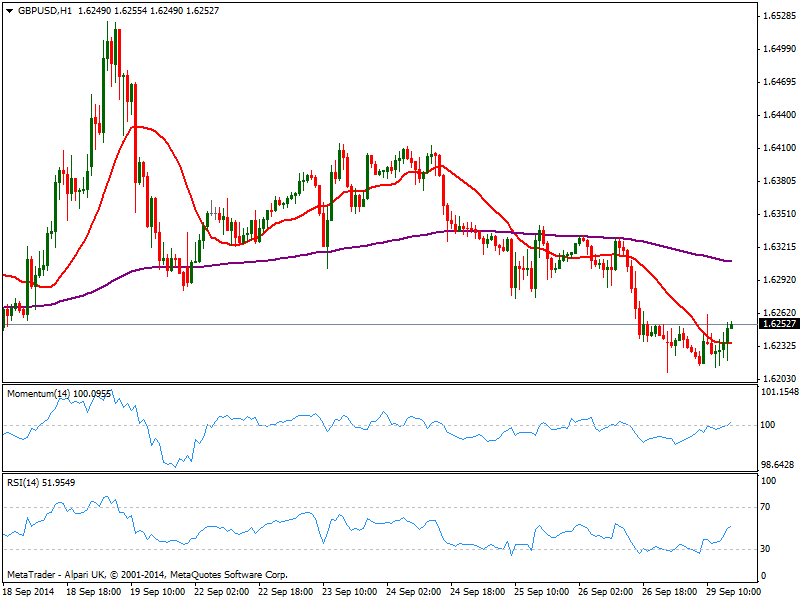
The GBP/USD trades range bound between a daily low of 1.6209 posted early Asia, and a daily high of 1.6261 reached early European opening, with a mild positive tone according to the 1 hour chart as price extends above a flat 20 SMA and indicators head higher around their midlines, lacking strength at the time being. In the 4 hours chart however, the bearish tone prevails, with 20 SMA presenting a clear bearish slope around 1.6300 and indicators directionless well into negative territory. A price acceleration above this last should lead to a quick advance up to 1.6340/50 price zone, strong static resistance level.
Support levels: 1.6220 1.6190 1.6160
Resistance levels: 1.6260 1.6300 1.6345
USD/JPY Current price: 109.19
View Live Chart for the USD/JPY
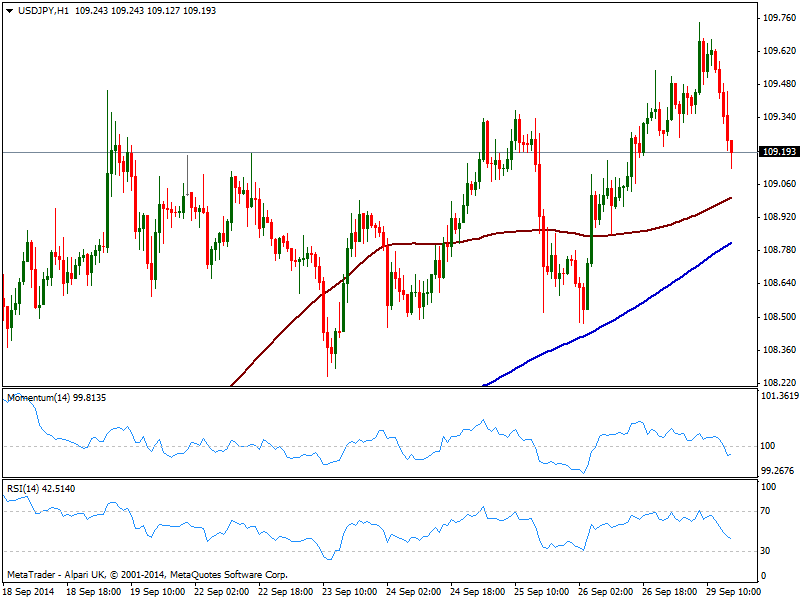
The USD/JPY eases from a fresh year high established at 109.74 following the slide in stocks, with the hourly chart showing price approaching 100 SMA immediate short term support currently at 108.95. Indicators in the same time frame head lower below their midlines, while the 4 hours chart shows indicators turned strongly south and rest now above their midlines. A break below mentioned support may see the pair extending quickly towards 108.50 price zone, where buyers have been surging over the last week. A break below this last however, may see another leg lower, with risk turning to the downside for the upcoming sessions.
Support levels: 108.95 108.50 108.20
Resistance levels: 109.45 109.80 110.20
AUD/USD Current price: 0.8734
View Live Chart of the AUD/USD
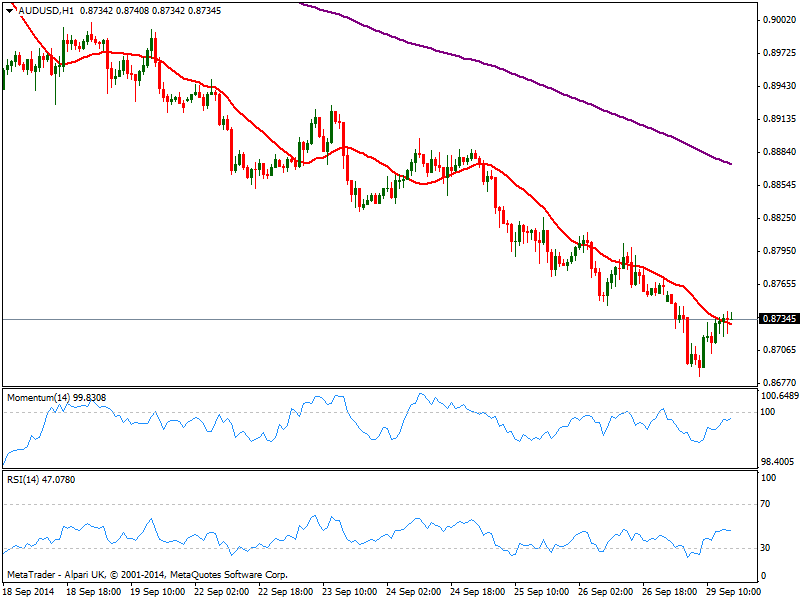
Australian dollar sees no relieve against the greenback, with the pair extending its bearish move down to 0.8683 this Monday, trading now back above the 0.8700 mark. The 1 hour chart shows price hovering around a bearish 20 SMA, while indicators corrected higher, but remain below their midlines now losing upward strength. In the 4 hours chart the overall bearish tone prevails with 20 SMA acting as latest intraday resistance in the 0.8800 price zone.
Support levels: 0.8710 0.8680 0.8635
Resistance levels: 0.8770 0.8800 0.8840
Recommended Content
Editors’ Picks
AUD/USD failed just ahead of the 200-day SMA

Finally, AUD/USD managed to break above the 0.6500 barrier on Wednesday, extending the weekly recovery, although its advance faltered just ahead of the 0.6530 region, where the key 200-day SMA sits.
EUR/USD met some decent resistance above 1.0700

EUR/USD remained unable to gather extra upside traction and surpass the 1.0700 hurdle in a convincing fashion on Wednesday, instead giving away part of the weekly gains against the backdrop of a decent bounce in the Dollar.
Gold stays firm amid higher US yields as traders await US GDP data

Gold recovers from recent losses, buoyed by market interest despite a stronger US Dollar and higher US Treasury yields. De-escalation of Middle East tensions contributed to increased market stability, denting the appetite for Gold buying.
Ethereum suffers slight pullback, Hong Kong spot ETH ETFs to begin trading on April 30

Ethereum suffered a brief decline on Wednesday afternoon despite increased accumulation from whales. This follows Ethereum restaking protocol Renzo restaked ETH crashing from its 1:1 peg with ETH and increased activities surrounding spot Ethereum ETFs.
Dow Jones Industrial Average hesitates on Wednesday as markets wait for key US data

The DJIA stumbled on Wednesday, falling from recent highs near 38,550.00 as investors ease off of Tuesday’s risk appetite. The index recovered as US data continues to vex financial markets that remain overwhelmingly focused on rate cuts from the US Fed.