EUR/USD Current price: 1.2831
View Live Chart for the EUR/USD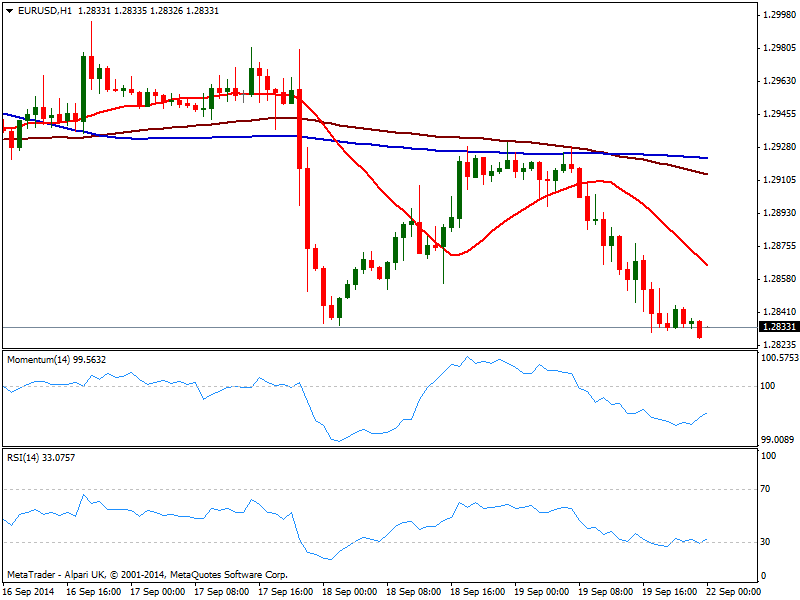
The EUR/USD trades effectively unchanged from Friday’s close, at a fresh year low set by New York closing bell. The week ahead, despite a much lighter calendar, will include Draghi’s testimony on monetary policy before the European Parliament's Economic and Monetary Committee, in Brussels mid European morning this Monday, which may imprint some intraday volatility to the pair. But beyond that, the dominant bearish trend remains firm in place despite oversold readings short and longer term.
Technically, the hourly chart shows price well below a bearish 20 SMA, currently around 1.2865 with indicators barely bouncing from oversold levels. In the 4 hours chart momentum continues to head south into negative territory, as RSI stands at 33 giving no signs of a probable recovery. Ahead of mentioned Draghi’s speech, the pair can remain range bound, with a price acceleration below 1.2810 however, opening doors for a slide down to 1.2740 price zone, strong long term static support.
Support levels: 1.2810 1.2770 1.2840
Resistance levels: 1.2865 1.2910 1.2950
EUR/JPY Current price: 140.05
View Live Chart for the EUR/JPY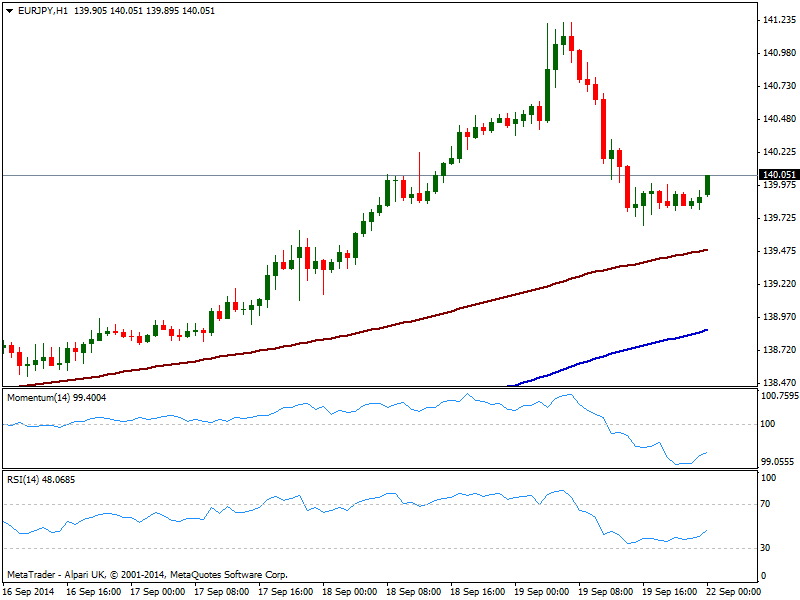
The EUR/JPY retraced from a 4-month high of 141.21, consolidating now around the 140.00 level. Yen weakness has been largely welcomed by BOJ Governor Kuroda who pledged to provide more stimulus if needed, a bit of jawboning to fuel markets. As a new week starts, the hourly chart shows price advancing above the 140.00 mark with indicators recovering from oversold territory, still below their midlines, and 100 SMA acting as intraday support in case of a decline around 139.50. In the 4 hours chart indicators corrected overbought conditions and slowly turn back north well into positive territory, suggesting latest retracement has been just corrective. Nevertheless the critical resistance stands at 140.40, and a recovery above it should support a steadier advance towards mentioned highs.
Support levels: 139.50 139.10 138.60
Resistance levels: 140.40 140.80 141.20
GBP/USD Current price: 1.6329
View Live Chart for the GBP/USD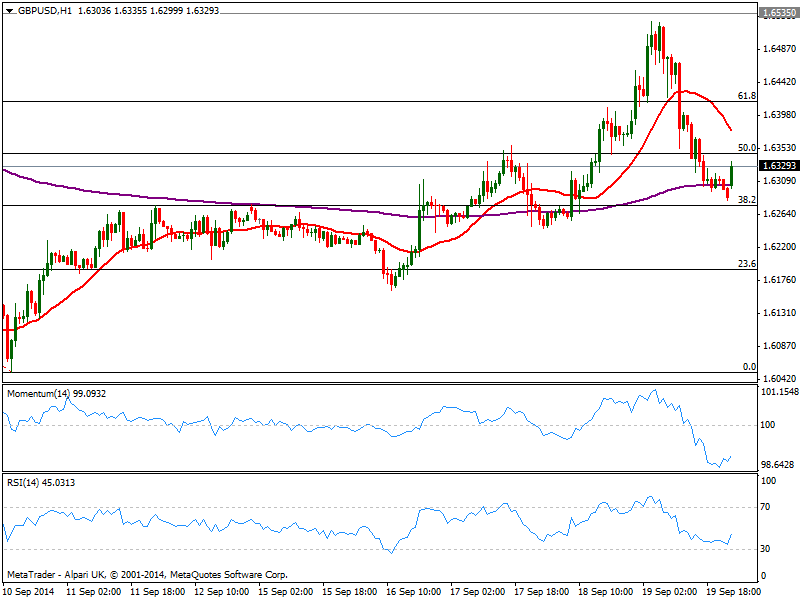
The GBP/USD has gave back all of the ground added on a discounted “NO” win before it actually happened, with investors profiting from latest rally to 1.6530 price zone. Trading around pre Scottish referendum fever levels, the hourly chart shows price firming up from the 38.2% retracement of this September fall from 1.6643 to 1.6051 at 1.6275, with indicators advancing some from oversold levels and 20 SMA heading strongly south well above current price. In the 4 hours chart 20 SMA converges with the 50% retracement of the same rally at 1.6345, offering immediate resistance, while indicators head south right below their midlines: some steady gains above the level should favor further intraday recoveries yet below 1.6270, risk turns to the downside, eyeing 1.6160 price zone.
Support levels: 1.6275 1.6220 1.6160
Resistance levels: 1.6345 1.6410 1.6470
USD/JPY Current price: 109.13
View Live Chart for the USD/JPY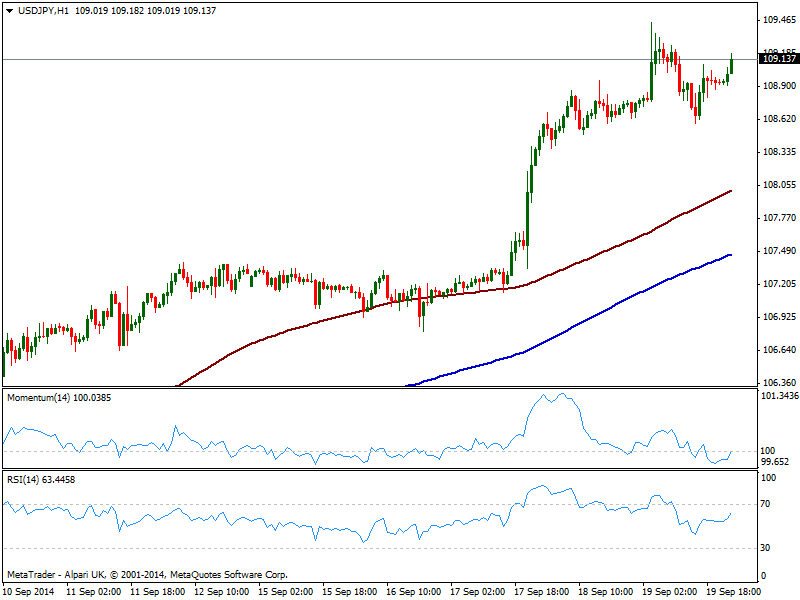
The USD/JPY holds above the 109.00 level, with yen unable to sustain modest advances against the greenback: latest retracement has found buyers in the 108.50/60 price zone, now immediate support, with 1 hour indicators aiming higher around their midlines, and moving averages maintaining their bullish slopes well below current price. In the 4 hours chart, indicators head higher in overbought territory after a limited downward correction, supporting the dominant bullish trend. Retracements down to mentioned price zone will likely attract buyers again while a break above 109.45 exposes the pair to an advance up to 110.00 critical figure.
Support levels: 108.95 108.55 108.10
Resistance levels: 109.45 109.75 110.20
AUD/USD Current price: 0.8921
View Live Chart of the AUD/USD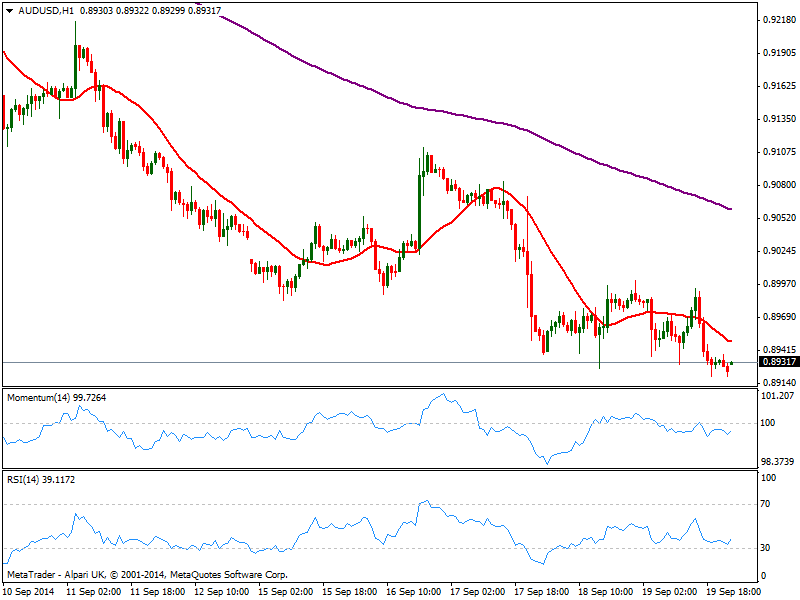
Having lost almost 5 cents since the month started the AUD/USD trades near 0.8900, levels not seen since March this year. The 1 hour chart shows price below a bearish territory, but indicators directionless below their midlines, showing no actual strength. In the 4 hours chart indicators present a mild bearish tone well into negative territory, with 20 SMA presenting a strong bearish slope now around 0.8990 acting as intraday resistance.
Support levels: 0.8910 0.8880 0.8830
Resistance levels: 0.8950 0.8990 0.8940
Recommended Content
Editors’ Picks
EUR/USD retreats below 1.0700 after US GDP data

EUR/USD came under modest bearish pressure and retreated below 1.0700. Although the US data showed that the economy grew at a softer pace than expected in Q1, strong inflation-related details provided a boost to the USD.
GBP/USD declines below 1.2500 as USD rebounds

GBP/USD declined below 1.2500 and erased the majority of its daily gains with the immediate reaction to the US GDP report. The US economy expanded at a softer pace than expected in Q1 but the price deflator jumped to 3.4% from 1.8%.
Gold drops below $2,320 as US yields shoot higher

Gold lost its traction and turned negative on the day below $2,320 in the American session on Thursday. The benchmark 10-year US Treasury bond yield is up more than 1% on the day above 4.7% after US GDP report, weighing on XAU/USD.
XRP extends its decline, crypto experts comment on Ripple stablecoin and benefits for XRP Ledger

Ripple extends decline to $0.52 on Thursday, wipes out weekly gains. Crypto expert asks Ripple CTO how the stablecoin will benefit the XRP Ledger and native token XRP.
After the US close, it’s the Tokyo CPI

After the US close, it’s the Tokyo CPI, a reliable indicator of the national number and then the BoJ policy announcement. Tokyo CPI ex food and energy in Japan was a rise to 2.90% in March from 2.50%.