EUR/USD Current price: 1.2869
View Live Chart for the EUR/USD
Investors are happy buying the dollar: that’s the easy conclusion after latest FED meeting, as the US Central Bank trimmed $10B as expected from their QE, confirmed the last $15B will be cut next October, and maintained their statement pretty much unchanged from previous one on July. There was no change in the wording, with rates likely to remain low for a considerable time, and the slack in the labor market still being significant. They have discussed how policy will return to normal, the from now on known principles of normalization that the FED has discussed and will likely adjust from those specified back in June 2011.
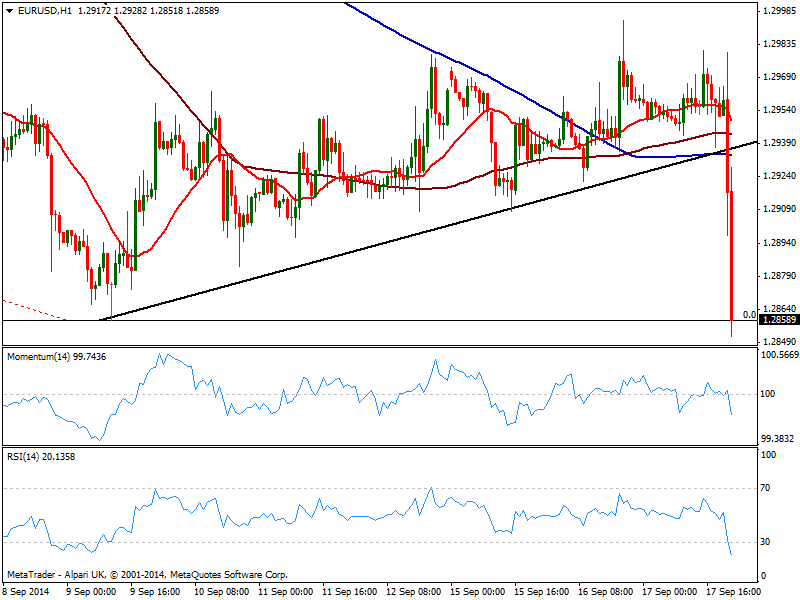
The greenback advanced with uneven strength against most rivals with the EUR and the JPY among the weakest: the EUR/USD extends its post news losses, to a fresh year low a few pips fellow previous one, reaching so far 1.2851. The 1 hour chart shows price broke below a daily ascendant trend line coming from previous year low of 1.2859 and slides below its moving averaged, while indicators present a clear bearish lope. In the 4 hours chart the bearish potential increased as indicators also turned lower entering negative territory, signaling a probable retest of mentioned year low. A break below it should fuel the dominant bearish trend with the pair eyeing then the 1.2740 strong midterm support zone.
Support levels: 1.2860 1.2825 1.2790
Resistance levels: 1.2920 1.2950 1.2990
EUR/JPY Current price: 139.26
View Live Chart for the EUR/JPY
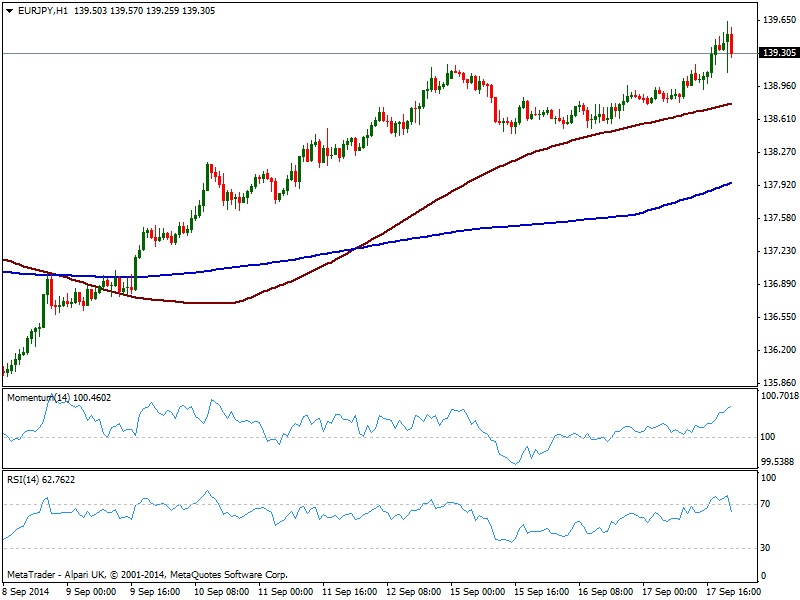
The EUR/JPY extended its advance up to 139.63 post FOMC, with yields near 2.6% and stocks strongly up keeping yen under selling pressure across the board. The overall sentiment is that the Federal Reserve is not going to raise interest rates anytime soon, so the party goes on. Technically, the EUR/JPY hourly chart shows price steady above its 100 SMA and indicators maintaining the bullish tone well into positive territory, despite the small pullback underway. In the 4 hours chart technical readings present a strong upward momentum, with further gains pointing for a test of critical 140.00 figure in the short term.
Support levels: 138.90 138.40 138.00
Resistance levels: 139.70 140.00 140.40
GBP/USD Current price: 1.6270
View Live Chart for the GBP/USD
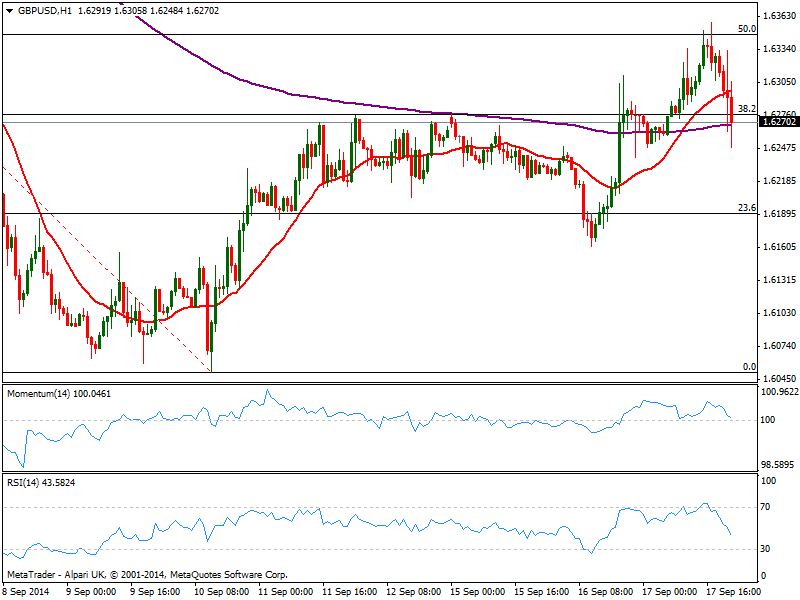
The GBP/USD retraces from a fresh two week high of 1.6358 posted early Europe, after better than expected UK employment figures. The pair shows quite limited moves compared to other currencies, with the market on hold ahead of Scottish referendum taking place this Thursday. Ahead of Asian opening, the pair trades around the 38.2% retracement of this month fall, practically unchanged on the day, with the 1 hour chart showing indicators gaining bearish tone but momentum still above 100, while 20 SMA caps now the upside around 1.6300. In the 4 hours chart indicators turned lower but also hold above their midlines, showing little bearish potential at the time being. Pound should be a wait and see until early Friday, when the results of the mentioned referendum will see the light.
Support levels: 1.6250 1.6220 1.6180
Resistance levels: 1.6315 1.6350 1.6385
USD/JPY Current price: 108.23
View Live Chart for the USD/JPY
The USD/JPY extended over 100 pips this Wednesday, nearing 108.40 at the end of the day and with the 1 hour chart showing indicators heading strongly up despite in extreme overbought levels. After holding in a tight range above its 100 SMA over the past few sessions, the pair has finally resumed the upside, with some static support back from 2008 monthly highs now in the 108.50 price zone. In the 4 hours chart technical readings also present a strong upward momentum, moreover because of latest range and the following breakout: further advances beyond 108.50 should see the pair looking to extend its rally towards critical 110.00 price zone over the upcoming days.
Support levels: 107.90 107.40 106.80
Resistance levels: 108.50 108.80 109.10
AUD/USD Current price: 0.8970
View Live Chart of the AUD/USD
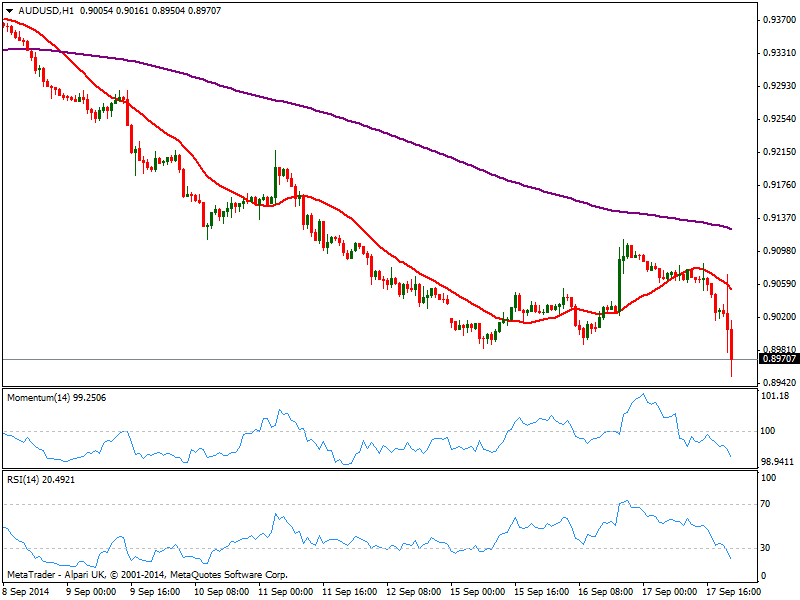
The AUD/USD falls below previous lows around 0.8990, establishing a firmer bearish tone in the midterm after the strong retracement form 0.9110 highs posted earlier this week. The technical picture is strongly bearish in the short term, with indicators heading south in oversold levels and 20 SMA gaining bearish slope well above current price. In the 4 hours chart price accelerated below its 20 SMA that presents now a bearish slope, while indicators turned south with momentum ready to cross 100. Next support stands at the 0.8950/60 price zone, with a break below signaling a probable downward continuation towards 0.8880 price zone.
Support levels: 0.8955 0.8920 0.8880
Resistance levels: 0.8990 0.8940 0.8985
Recommended Content
Editors’ Picks
EUR/USD clings to daily gains above 1.0650

EUR/USD gained traction and turned positive on the day above 1.0650. The improvement seen in risk mood following the earlier flight to safety weighs on the US Dollar ahead of the weekend and helps the pair push higher.
GBP/USD recovers toward 1.2450 after UK Retail Sales data

GBP/USD reversed its direction and advanced to the 1.2450 area after touching a fresh multi-month low below 1.2400 in the Asian session. The positive shift seen in risk mood on easing fears over a deepening Iran-Israel conflict supports the pair.
Gold holds steady at around $2,380 following earlier spike

Gold stabilized near $2,380 after spiking above $2,400 with the immediate reaction to reports of Israel striking Iran. Meanwhile, the pullback seen in the US Treasury bond yields helps XAU/USD hold its ground.
Bitcoin Weekly Forecast: BTC post-halving rally could be partially priced in Premium

Bitcoin price shows no signs of directional bias while it holds above $60,000. The fourth BTC halving is partially priced in, according to Deutsche Bank’s research.
Week ahead – US GDP and BoJ decision on top of next week’s agenda

US GDP, core PCE and PMIs the next tests for the Dollar. Investors await BoJ for guidance about next rate hike. EU and UK PMIs, as well as Australian CPIs also on tap.