EUR/USD Current price: 1.3184
View Live Chart for the EUR/USD
Majors were choppy this Thursday, but for the surprise of none European majors held within weekly ranges. Fundamental data when it comes to Europe, resulted again a bit disappointing, with less employment in Germany, and a drop in EZ confidence. But in the US, the second reading of the quarterly GDP came above expected up to 4.2%, weekly unemployment claims held below 300K last week, and pending home sales pushed strongly up, printing a 3.3% increase in July, widening the imbalance between the economic health of the two major powers. Some risk aversion triggered by Ukrainian woes early US session also weighed on the EUR/USD that anyway managed to post a higher high for the week at 1.3220 that anyway was short lived.
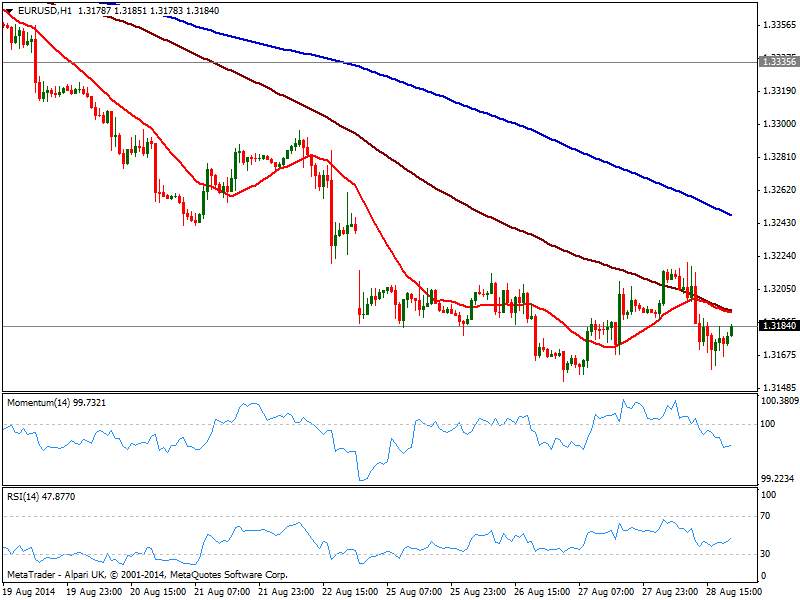
Technically, the pair has shown little progress once again, as investors will probably wait for upcoming EZ inflation readings before positioning for next week key fundamental readings. In the short term, the hourly chart shows price below 20 and 100 SMA, both converging now around 1.3195 and presenting a strong bearish slope, while indicators lost downward potential and remain in negative territory. In the 4 hours chart a mild bearish tone is also present, albeit indicators lack directional momentum at the time being, suggesting the 1.3150/1.3220 will extend into Friday, and more likely into next week.
Support levels: 1.3150 1.3120 1.3090
Resistance levels: 1.3215 1.3240 1.3280
EUR/JPY Current price: 136.67
View Live Chart for the EUR/JPY
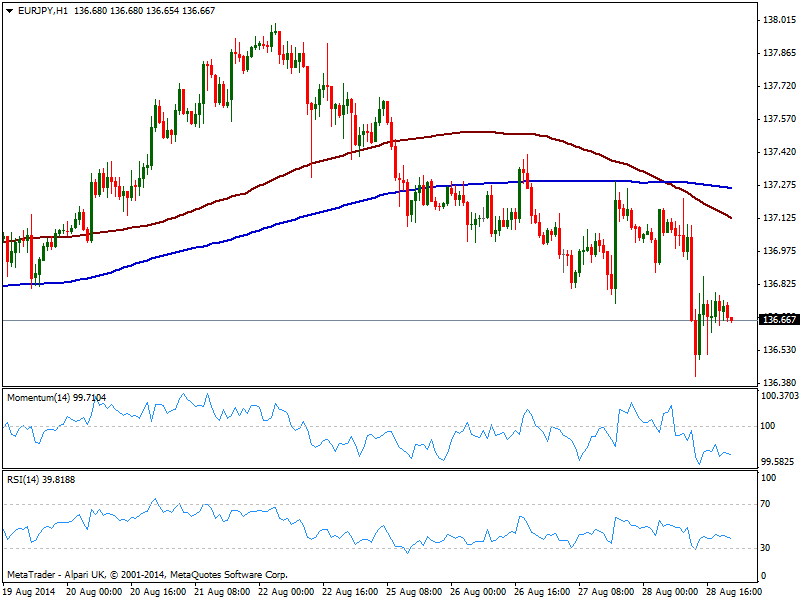
Yen was on demand along with safe haven Swiss Franc, on the back of rising tensions between Russia and Ukraine, with the last reporting a military invasion of the first. Risk aversion along with EUR weakness were enough to push the pair down to 136.41, from where the pair bounced some over US hours, now trading below the 136.90 mark immediate resistance. Technically, the hourly chart shows 100 SMA crossed to the downside 200 one and gain bearish slope, reflecting the strong selling interest, while indicators maintain the bearish stance heading lower in negative territory. In the 4 hours chart the overall outlook is also bearish, albeit indicators seem to be losing the downward strength as per turning flat in negative territory: some follow through below mentioned daily low however, exposes the pair to a downward continuation towards 135.70 area, early August lows.
Support levels: 136.40 136.00 135.70
Resistance levels: 136.9 137.35 137.60
GBP/USD Current price: 1.6586
View Live Chart for the GBP/USD
The GBP/USD also overcame its previous high by a handful of pips, reaching 1.6613 in a short lived spike before pulling back down below the 1.6600 mark, having managed also to post a higher high daily basis. Nevertheless the pair has been confined to a 70 pips range for all of this week, meaning there’s little support for a directional move at the time being. Technically, the short term picture shows price hovering around a flat 20 SMA and indicators in neutral territory in the 1 hour chart, while the 4 hours one shows exactly the same picture. Some steady advance beyond 1.6600 is required to see price extending up to 1.6660 price zone, a daily descendant trend line coming from this year high, while buyers may desist on a strong downward acceleration through 1.6540 support zone.
Support levels: 1.6540 1.6490 1.6465
Resistance levels: 1.6600 1.6630 1.6660
USD/JPY Current price: 103.66
View Live Chart for the USD/JPY
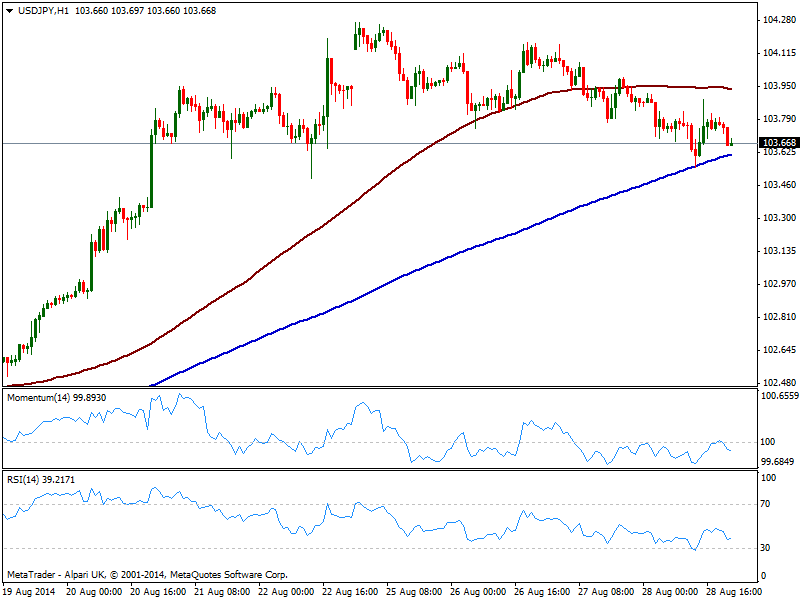
The USD/JPY stands at the base of its recent range, having posted a weekly low of 103.55 on Ukrainian news. The dollar early week advance finds itself in a hard time particularly against safe havens, but also affected for some end month profit taking, something than can accelerate on Friday. In the meantime, the hourly chart shows price has extended below its 100 SMA, finding support in the 200 one around mentioned daily low, while indicators turned south after reaching their midlines. In the 4 hours chart indicators gain bearish momentum, and continue to support further declines, eyeing a quick run towards 103.20 intraday support if mentioned daily low gives up.
Support levels: 103.55 103.20 102.85
Resistance levels: 104.20 104.50 104.80
AUD/USD Current price: 0.9353
View Live Chart for AUD/USD
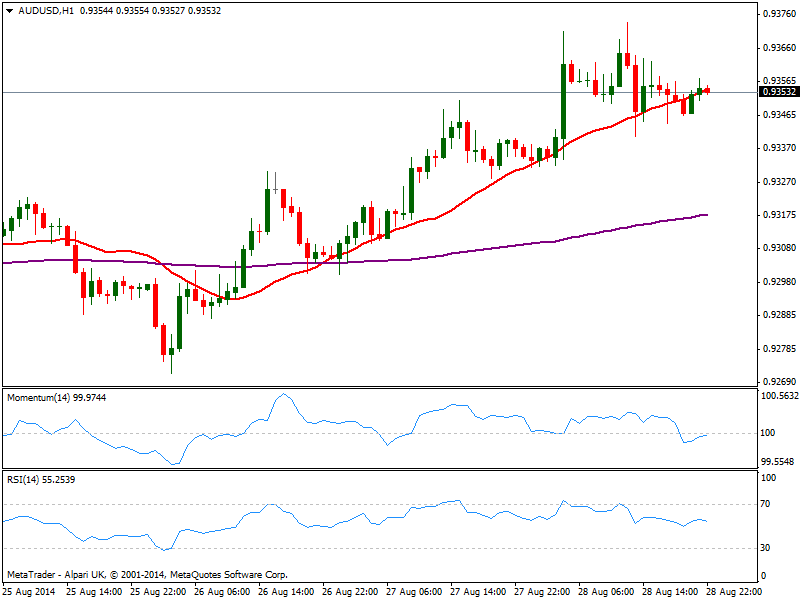
Commodity currencies were again much stronger than European ones, with AUD/USD advancing up to 0.9373, fresh 3-week high, maintaining its intraday gains as a new day starts: the pair is now finding short term buyers in former resistance and critical level around 0.9330 and as long as above it bulls will remain in control. Technically, the 1 hour chart shows price hovering around a bullish 20 SMA, while indicators give no much clues on direction, as per being flat around their midlines. In the 4 hours chart momentum retraces from its highs heading south in positive territory, while RSI maintains its bullish tone near overbought levels. In this last time frame 20 SMA presents a strong upward slope below current price, offering some intraday support now around 0.9325, reinforcing the strength of the mentioned support. Further gains should see the pair testing 0.9420 price zone, while a break above this last exposes the 0.9460 price zone.
Support levels: 0.9330 0.9300 0.9260
Resistance levels: 0.9370 0.9410 0.9450
Recommended Content
Editors’ Picks
AUD/USD pressures as Fed officials hold firm on rate policy

The Australian Dollar is on the defensive against the US Dollar, as Friday’s Asian session commences. On Thursday, the antipodean clocked losses of 0.21% against its counterpart, driven by Fed officials emphasizing they’re in no rush to ease policy. The AUD/USD trades around 0.6419.
EUR/USD extends its downside below 1.0650 on hawkish Fed remarks

The EUR/USD extends its downside around 1.0640 after retreating from weekly peaks of 1.0690 on Friday during the early Asian session. The hawkish comments from Federal Reserve officials provide some support to the US Dollar.
Gold price edges higher on risk-off mood hawkish Fed signals

Gold prices advanced late in the North American session on Thursday, underpinned by heightened geopolitical risks involving Iran and Israel. Federal Reserve officials delivered hawkish messages, triggering a jump in US Treasury yields, which boosted the Greenback.
Runes likely to have massive support after BRC-20 and Ordinals frenzy

With all eyes peeled on the halving, Bitcoin is the center of attention in the market. The pioneer cryptocurrency has had three narratives this year already, starting with the spot BTC exchange-traded funds, the recent all-time high of $73,777, and now the halving.
Billowing clouds of apprehension

Thursday marked the fifth consecutive session of decline for US stocks as optimism regarding multiple interest rate cuts by the Federal Reserve waned. The downturn in sentiment can be attributed to robust economic data releases, prompting traders to adjust their expectations for multiple rate cuts this year.