EUR/USD Current price: 1.3177
View Live Chart for the EUR/USD
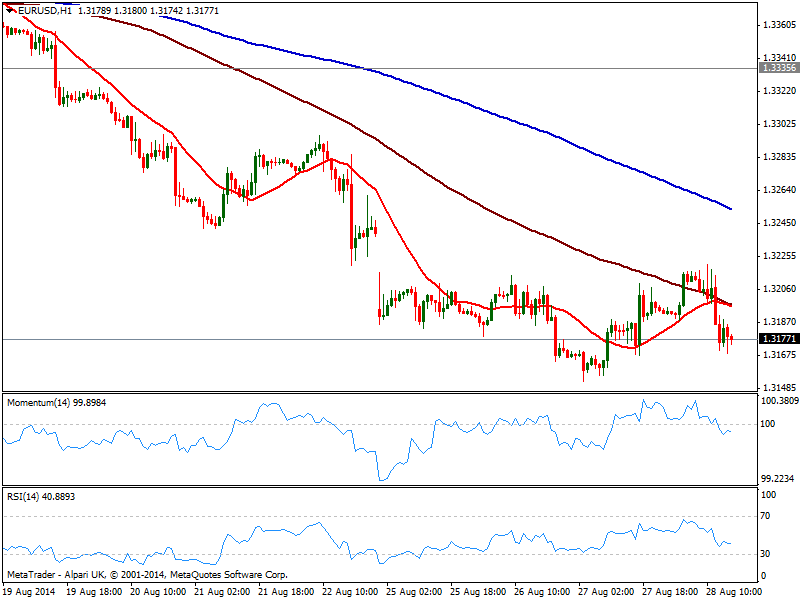
Once again, the EUR/USD retreated from the 1.3210/20 price zone, under pressure early US session after better than expected GDP numbers, revised up to 4.2%. Earlier on the day, safe havens got a boost from news Russia invaded Ukraine, but the movements across the board remain shallow, with majors within latest ranges. Technically, the hourly chart for EUR/USD shows an increasing bearish potential, with indicators heading strongly down into negative territory and price below 20 SMA. In the 4 hours chart price continues to hover back and forth around a flat 20 SMA, with indicators turning lower in neutral territory. A break below 1.3150 should see the pair extending its decline towards the 1.3100 price zone, albeit market is expected to remain on hold, ahead of tomorrow EZ inflation data, and next week Central Bank meeting.
Support levels: 1.3150 1.3120 1.3090
Resistance levels: 1.3215 1.3240 1.3280
GBP/USD Current price: 1.6578
View Live Chart for the GBP/USD
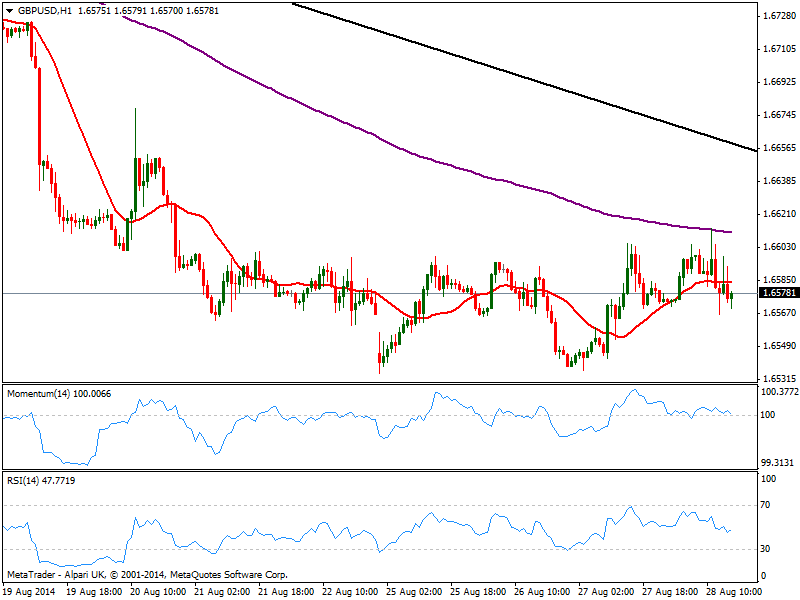
The GBP/USD daily advance stalled at 1.6604, with the pair back to its comfort zone around 1.6570/80 where it stood for most of this week. The hourly chart shows price right below its 20 SMA but indicators still hovering around their midlines, lacking clear direction. In the 4 hours chart the technical picture is also neutral, with some steady advance either above 1.6600 or below 1.6540 required to trigger a clearer directional move.
Support levels: 1.6540 1.6490 1.6465
Resistance levels: 1.6600 1.6630 1.6660
USD/JPY Current price: 103.73
View Live Chart for the USD/JPY
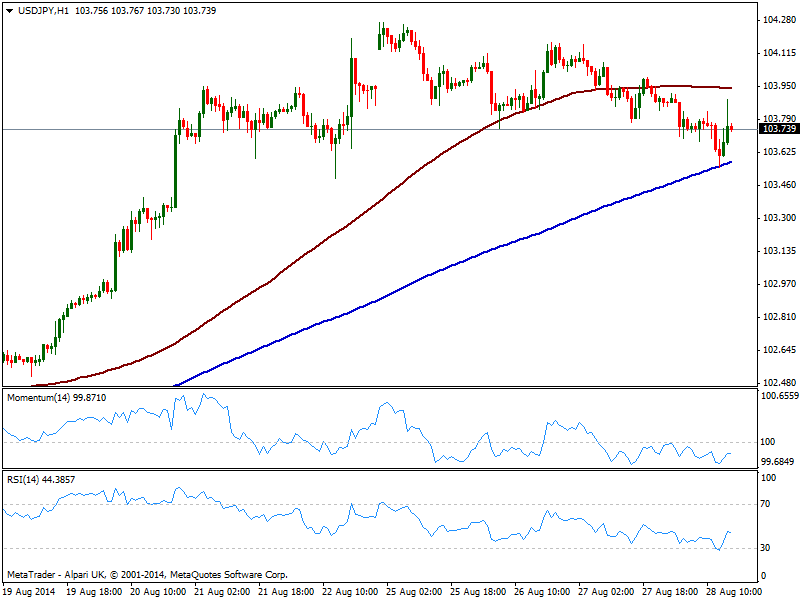
The USD/JPY sees some downward pressure on risk aversion, but the pair found intraday demand at its 200 SMA in the hourly chart currently at 103.55, but remains below 100 one and indicators lose upward potential in negative territory. In the 4 hours chart the technical picture is bearish, with indicators heading south below their midlines, supporting another leg lower in the short term, moreover if local share markets remain under pressure.
Support levels: 103.55 103.20 102.85
Resistance levels: 104.20 104.50 104.80
AUD/USD Current price: 0.9356
View Live Chart for the AUD/USD
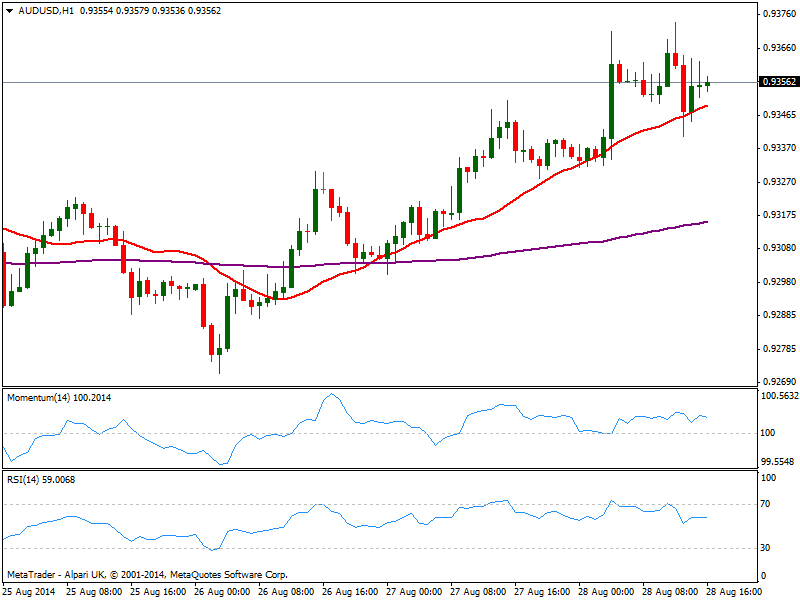
The AUD/USD reached 0.9373 before pulling back, maintaining however a mild bullish tone, as per price steady above 0.9330 immediate support and the hourly chart showing price finding short term support in a mild bullish 20 SMA and indicators in positive territory. In the 4 hours chart indicators are getting exhausted to the upside near overbought levels, yet a downward correction will be subdue to a break below mentioned 0.9330 strong static support.
Support levels: 0.9330 0.9300 0.9260
Resistance levels: 0.9370 0.9410 0.9450
Recommended Content
Editors’ Picks
AUD/USD remained bid above 0.6500

AUD/USD extended further its bullish performance, advancing for the fourth session in a row on Thursday, although a sustainable breakout of the key 200-day SMA at 0.6526 still remain elusive.
EUR/USD faces a minor resistance near at 1.0750

EUR/USD quickly left behind Wednesday’s small downtick and resumed its uptrend north of 1.0700 the figure, always on the back of the persistent sell-off in the US Dollar ahead of key PCE data on Friday.
Gold holds around $2,330 after dismal US data

Gold fell below $2,320 in the early American session as US yields shot higher after the data showed a significant increase in the US GDP price deflator in Q1. With safe-haven flows dominating the markets, however, XAU/USD reversed its direction and rose above $2,340.
Bitcoin price continues to get rejected from $65K resistance as SEC delays decision on spot BTC ETF options

Bitcoin (BTC) price has markets in disarray, provoking a broader market crash as it slumped to the $62,000 range on Thursday. Meanwhile, reverberations from spot BTC exchange-traded funds (ETFs) continue to influence the market.
US economy: slower growth with stronger inflation

The dollar strengthened, and stocks fell after statistical data from the US. The focus was on the preliminary estimate of GDP for the first quarter. Annualised quarterly growth came in at just 1.6%, down from the 2.5% and 3.4% previously forecast.