EUR/USD Current price: 1.3170
View Live Chart for the EUR/USD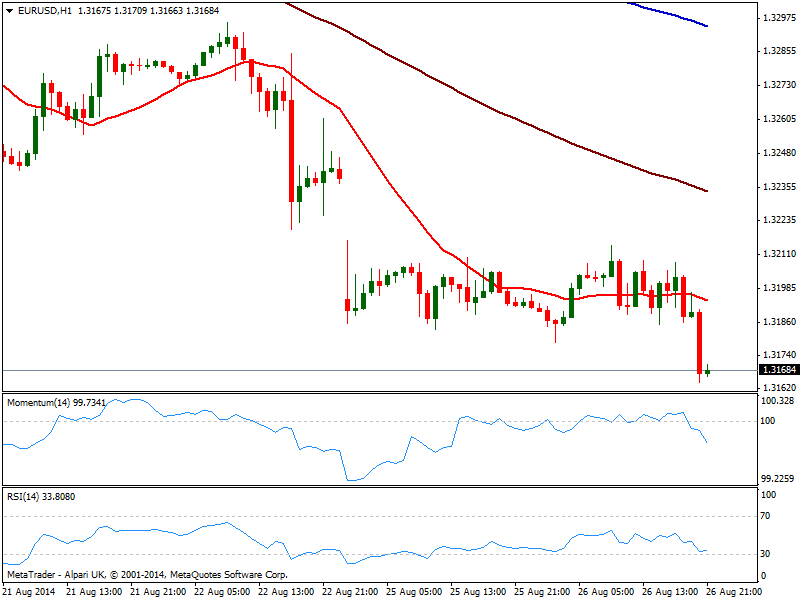
Action for a change, took place in the American session, with the dollar accelerating higher across the board as stops got triggered on low volumes. For the most, European currencies consolidated within range near their recent multi-month lows against the greenback in the during the first half of the day, with little fundamental news in the old continent, albeit in the US, Durable Goods Orders jumped to 22.6%, with the ex-transportation number resulting down to -0.8%: that resulted from strong gains due to unusually large aircraft orders, albeit the rest of the sectors had remained subdued. Consumer confidence also in the US however, climbed to its highest since 2007, printing an outstanding 92.4, with the dollar regaining the few pips lost after Durable Goods Orders.
The EUR/USD trades at fresh year lows, having so far posted at 1.3164, with the hourly chart showing a stronger downward momentum, albeit due to the sudden break lower, and not because strong selling interest at the time being. In the 4 hours chart indicators head lower near oversold levels, while 20 SMA offers now intraday resistance in the 1.3220 price zone. The dominant bearish trend supports further slides ahead, looking for a test of the 1.3100 figure during the upcoming session.
Support levels: 1.3160 1.3125 1.3090
Resistance levels: 1.3185 1.3220 1.3250
EUR/JPY Current price: 137.13
View Live Chart for the EUR/JPY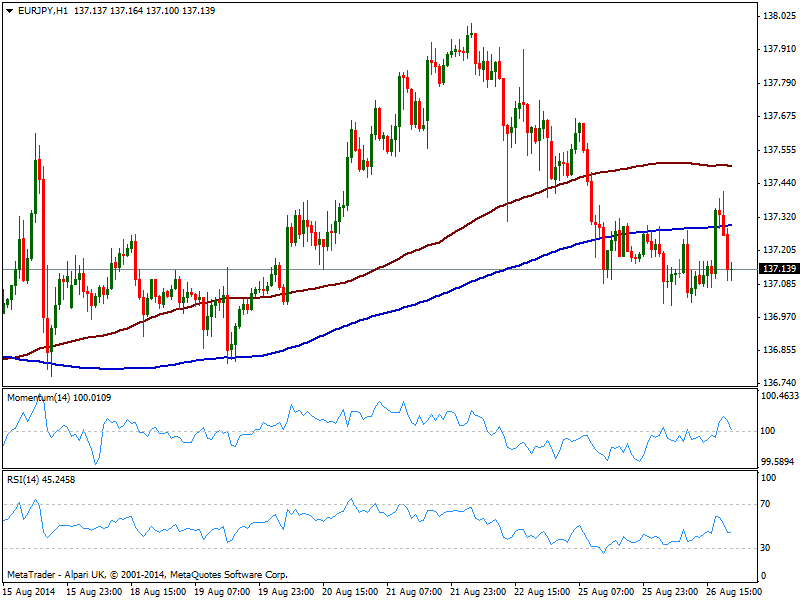
The EUR/JPY attempt of recovery faltered around 137.40, with the pair down a few pips its daily opening, holding for now above the 137.00 figure. US indexes traded positive for most of the day thus not far away from yesterday’s closes, with the S&P a few points above 2000 for most of the day. As for the EUR/JPY, the hourly chart shows price extending below its 200 SMA while indicators turned lower but hold so far above their midlines. In the 4 hours chart price hovers around both 100 and 200 SMA, together in a 20 pips range, reflecting latest lack of clear direction, while indicators diverge in negative territory. Price needs to break below the 136.90 to be more bearish constructive towards the 136.00 price zone.
Support levels: 136.90 136.40 136.00
Resistance levels: 137.35 137.60 138.00
GBP/USD Current price: 1.6547
View Live Chart for the GBP/USD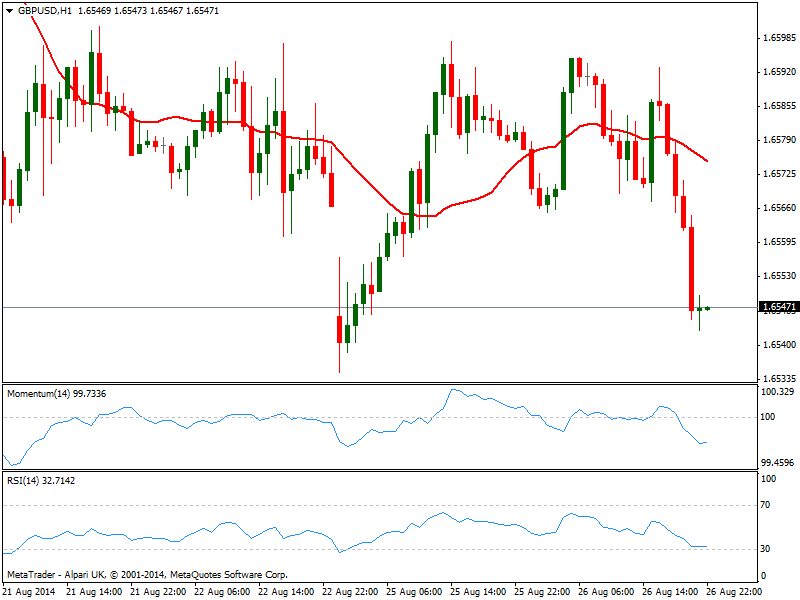
The GBP/USD pressures 1.6540 support area ahead of Asian opening, with the hourly chart showing price extending away from a mild bearish 20 SMA and momentum turning flat in negative territory, showing not much strength at the time being. In the 4 hours chart indicators gained some bearish slope, but momentum remains around its midline, leaving a neutral to bearish technical stance: some downward acceleration with volume through 1.6540 area is required to see the pair extending its decline, pointing then for a probable test of 1.6465 strong static support.
Support levels: 1.6540 1.6490 1.6465
Resistance levels: 1.6600 1.6630 1.6660
USD/JPY Current price: 104.09
View Live Chart for the USD/JPY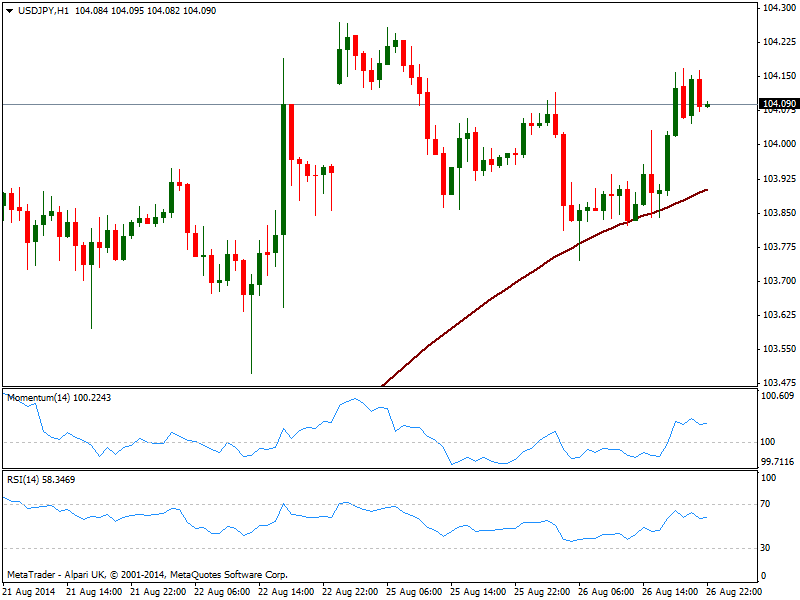
The USD/JPY consolidated around 104.00, having held above 103.70 support yet unable to extend gains beyond recent highs. The hourly chart shows price bounced several times from its 100 SMA, with indicators above their midlines yet showing no directional strength. In the 4 hours chart the technical outlook is also positive but with no directional strength. Some follow through beyond 104.45 is required to confirm a new leg higher, pointing then for a test of 105.00/10 price zone.
Support levels: 103.70 103.20 102.85
Resistance levels: 104.45 104.80 105.10
AUD/USD Current price: 0.9306
View Live Chart for the AUD/USD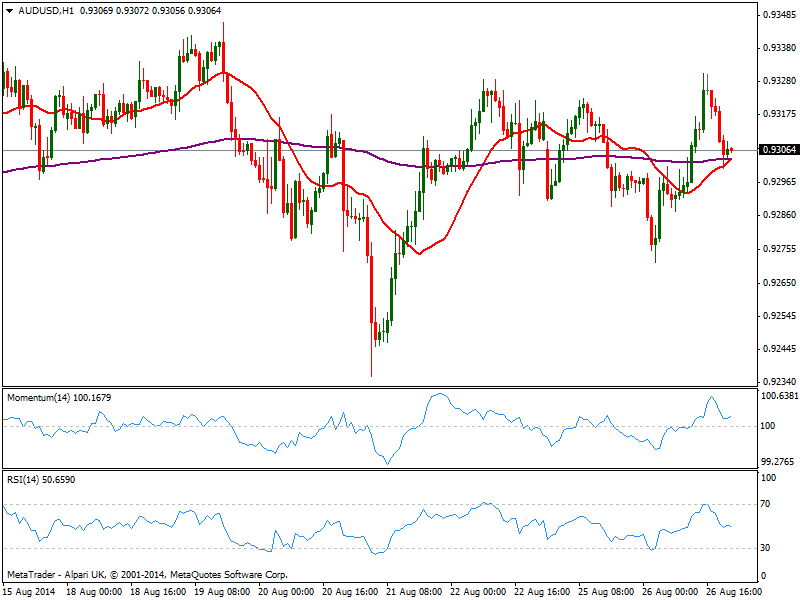
The AUD/USD found some demand on gold strength and rising stocks, but sellers were stronger at critical 0.9330 resistance, and price retreated from the level. Consolidating around the 0.9300 and with the hourly chart showing price nearing a bullish 20 SMA, a few pips below current price, as indicators corrected overbought readings but stand far from suggesting further falls ahead. In the 4 hours chart the technical picture is neutral, as indicators hover around their midlines with little directional potential.
Support levels: 0.9260 0.9220 0.9180
Resistance levels: 0.9330 0.9370 0.9410
Recommended Content
Editors’ Picks
EUR/USD clings to daily gains above 1.0650

EUR/USD gained traction and turned positive on the day above 1.0650. The improvement seen in risk mood following the earlier flight to safety weighs on the US Dollar ahead of the weekend and helps the pair push higher.
GBP/USD recovers toward 1.2450 after UK Retail Sales data

GBP/USD reversed its direction and advanced to the 1.2450 area after touching a fresh multi-month low below 1.2400 in the Asian session. The positive shift seen in risk mood on easing fears over a deepening Iran-Israel conflict supports the pair.
Gold holds steady at around $2,380 following earlier spike

Gold stabilized near $2,380 after spiking above $2,400 with the immediate reaction to reports of Israel striking Iran. Meanwhile, the pullback seen in the US Treasury bond yields helps XAU/USD hold its ground.
Bitcoin Weekly Forecast: BTC post-halving rally could be partially priced in Premium

Bitcoin price shows no signs of directional bias while it holds above $60,000. The fourth BTC halving is partially priced in, according to Deutsche Bank’s research.
Week ahead – US GDP and BoJ decision on top of next week’s agenda

US GDP, core PCE and PMIs the next tests for the Dollar. Investors await BoJ for guidance about next rate hike. EU and UK PMIs, as well as Australian CPIs also on tap.