EUR/USD Current price: 1.3192
View Live Chart for the EUR/USD
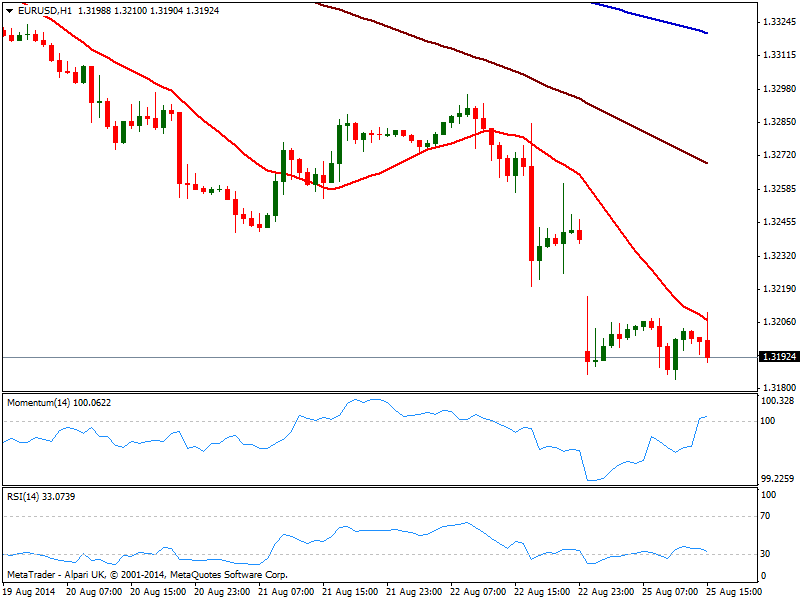
Dollar made a pause in a quiet European session without London, with the greenback correcting lower against most rivals. Nevertheless, the American currency resumes its advance early US session, with the EUR/USD trading around the 1.3200 level after a limited upward spike that ended up shy of 1.3220. The hourly chart shows price capped by its 20 SMA with indicators directionless as per recent range, RSI near oversold levels, and Momentum in neutral territory. In the 4 hours chart the overall technical stance is bearish, with a break through 1.3185 probably anticipating a continued slide towards the 1.3100/20 price zone.
Support levels: 1.3185 1.3150 1.3120
Resistance levels: 1.3210 1.3240 1.3270
GBP/USD Current price: 1.6580
View Live Chart for the GBP/USD
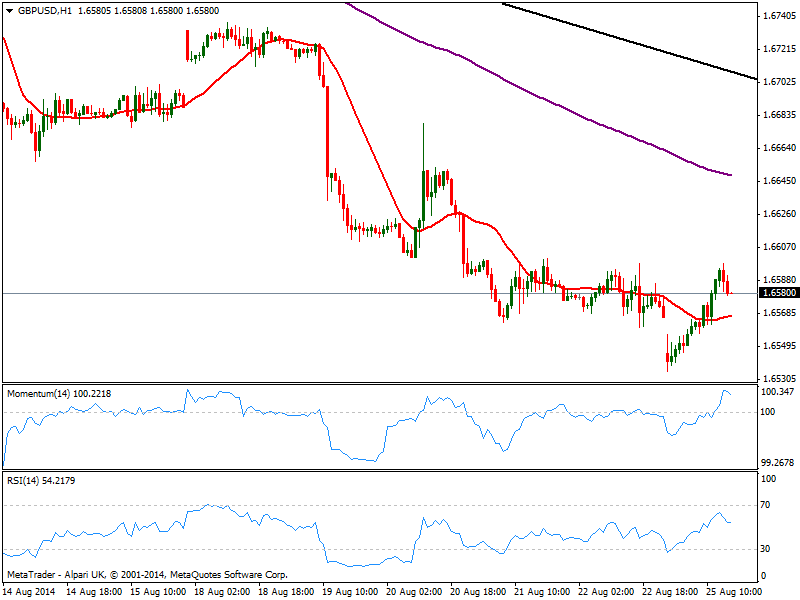
The GBP/USD recovered some ground contained however by recent highs around 1.6600, unable to post some decent advance. The hourly chart shows price holding above a flat 20 SMA and indicators turning south still above their midlines, while the 4 hours chart shows 20 SMA capped the upside around mentioned level while indicators hover around their midlines, far from signaling further recoveries. For the most, the downside remains favored albeit a clear break below 1.6540 price zone is required to confirm the new leg down.
Support levels: 1.6540 1.6490 1.6465
Resistance levels: 1.6600 1.6630 1.6680
USD/JPY Current price: 104.03
View Live Chart for the USD/JPY
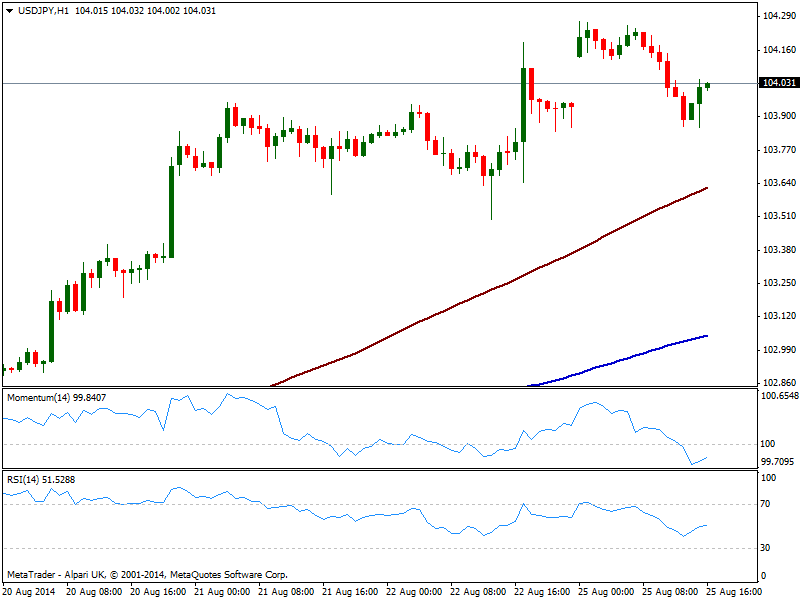
The USD/JPY filled the weekly opening gap, extending its intraday slide down to 103.85, but the positive tone among stocks helped the pair regain the 104.00 level. The hourly chart shows price standing well above 100 SMA currently around 103.70, as indicators head higher still in negative territory. In the 4 hours chart indicators corrected overbought readings and turn flat lacking directional strength at the time being. With stocks up, chances are to the upside, eyeing 104.45 as immediate resistance to break to confirm and advance towards the 105.00 figure.
Support levels: 104.05 103.60 103.20
Resistance levels: 104.45 104.80 105.25
AUD/USD Current price: 0.9290
View Live Chart for the AUD/USD
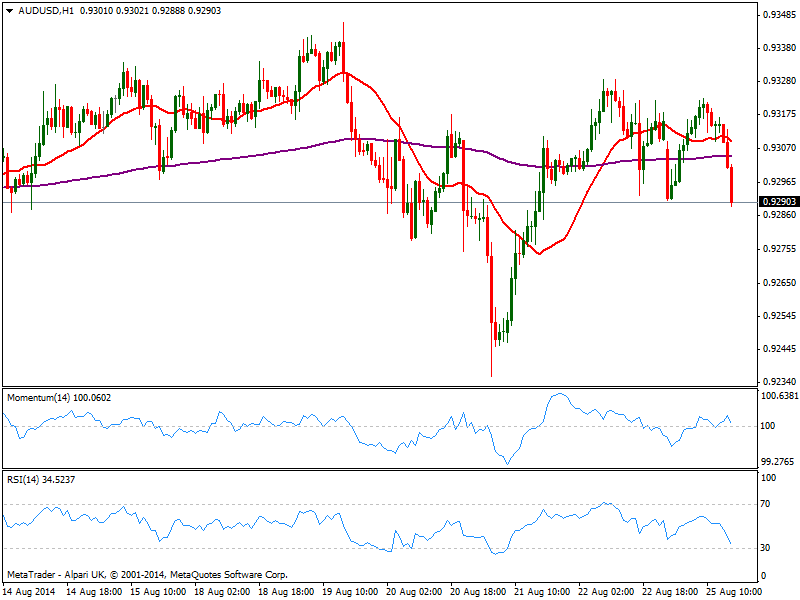
Trading at fresh daily lows, the AUD/USD advanced up to 0.9322 during Asian hours, only to turn back south as per selling interest surging on approaches to critical 0.9330 price zone. The hourly chart shows price accelerating below its 20 MSA and indicators turning lower, with RSI now nearing 35 and momentum steady right above 100. In the 4 hours chart price is now below a flat 20 SMA that offers however, little technical information as per being flat, while momentum diverges from price action, still heading higher above its midline.
Support levels: 0.9260 0.9220 0.9180
Resistance levels: 0.9330 0.9370 0.9410
Recommended Content
Editors’ Picks
EUR/USD clings to daily gains above 1.0650

EUR/USD gained traction and turned positive on the day above 1.0650. The improvement seen in risk mood following the earlier flight to safety weighs on the US Dollar ahead of the weekend and helps the pair push higher.
GBP/USD recovers toward 1.2450 after UK Retail Sales data

GBP/USD reversed its direction and advanced to the 1.2450 area after touching a fresh multi-month low below 1.2400 in the Asian session. The positive shift seen in risk mood on easing fears over a deepening Iran-Israel conflict supports the pair.
Gold holds steady at around $2,380 following earlier spike

Gold stabilized near $2,380 after spiking above $2,400 with the immediate reaction to reports of Israel striking Iran. Meanwhile, the pullback seen in the US Treasury bond yields helps XAU/USD hold its ground.
Bitcoin Weekly Forecast: BTC post-halving rally could be partially priced in Premium

Bitcoin price shows no signs of directional bias while it holds above $60,000. The fourth BTC halving is partially priced in, according to Deutsche Bank’s research.
Week ahead – US GDP and BoJ decision on top of next week’s agenda

US GDP, core PCE and PMIs the next tests for the Dollar. Investors await BoJ for guidance about next rate hike. EU and UK PMIs, as well as Australian CPIs also on tap.