EUR/USD Current price: 1.3457
View Live Chart for the EUR/USD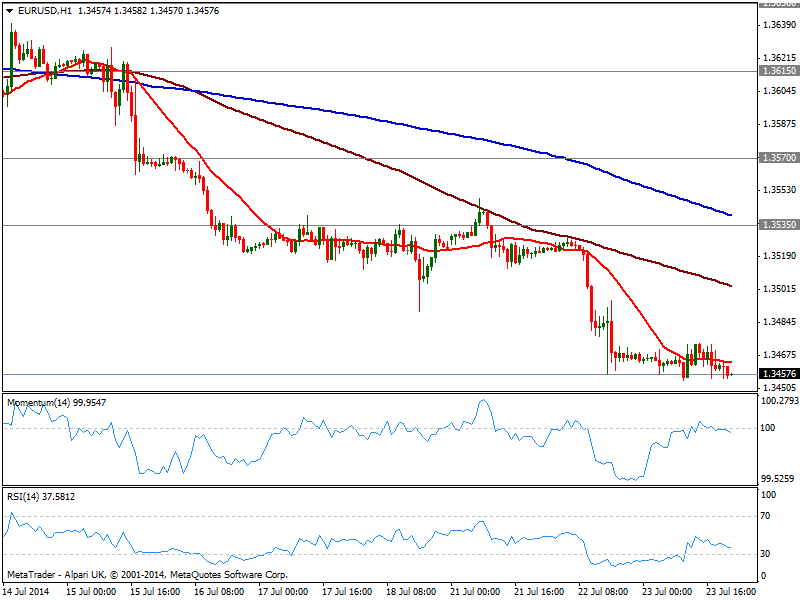
The EUR/USD trades lower in range, having extended its decline down to 1.3454 fresh year low, and unable to recover above 1.3475 former one broken last Tuesday. In the fundamental front, EU consumer confidence dropped down to -8.4 in July, while there was no major US data to affect currencies. European stocks edged higher, but US indexes stand near breakeven by the end of the American session, not before the S&P reached a fresh all time high.
With little to drive the pair, the EUR/USD remained contained in a tight 20 pips range, maintaining anyway the bearish bias intact. In the short term, the hourly chart shows price right below its 20 SMA and indicators gaining bearish tone below their midlines, while in the 4 hours one indicators continue heading lower despite in oversold territory, leaving little room for recoveries. European PMI readings early Thursday can be the trigger the market needs, with upward corrections up to 1.3570 seen as selling opportunities rather than probable signs of a reversal.
Support levels: 1.3445 1.3410 1.3380
Resistance levels: 1.3500 1.3535 1.3570
EUR/JPY Current price: 136.65
View Live Chart for the EUR/JPY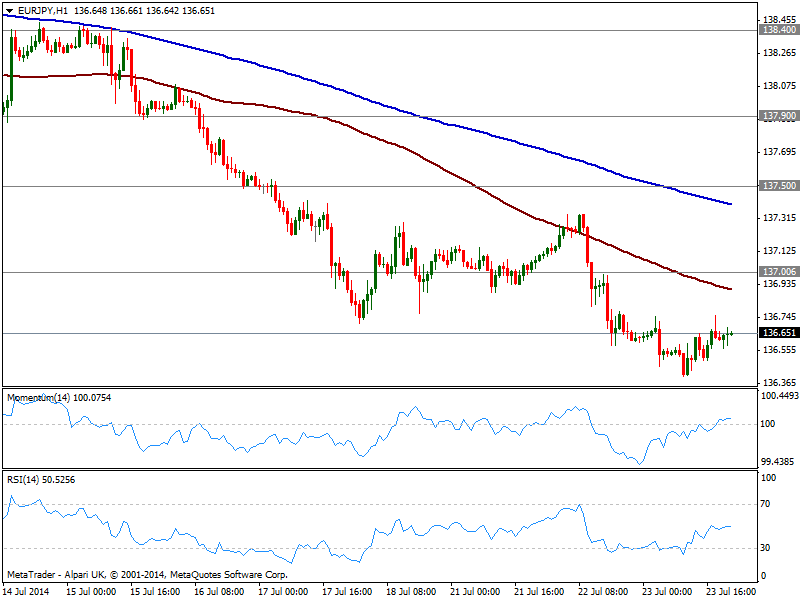
The EUR/JPY was again weighted by EUR weakness, albeit the slide remained limited by stocks positive tone along the day. Barely unchanged on the day, the hourly chart shows moving averages maintain a strong bearish bias above current price, while indicators lay flat above their midlines, indicating little buying interest around. In the 4 hours chart however, indicators aim higher still in negative territory, with RSI bouncing from oversold levels, pointing for some advance ahead: in that case 137.00 price zone stands as immediate resistance and only above it the pair may extend it advance, eyeing 137.50 in the short term.
Support levels: 136.60 136.20 135.75
Resistance levels: 137.00 137.50 137.90
GBP/USD Current price: 1.7030
View Live Chart for the GBP/USD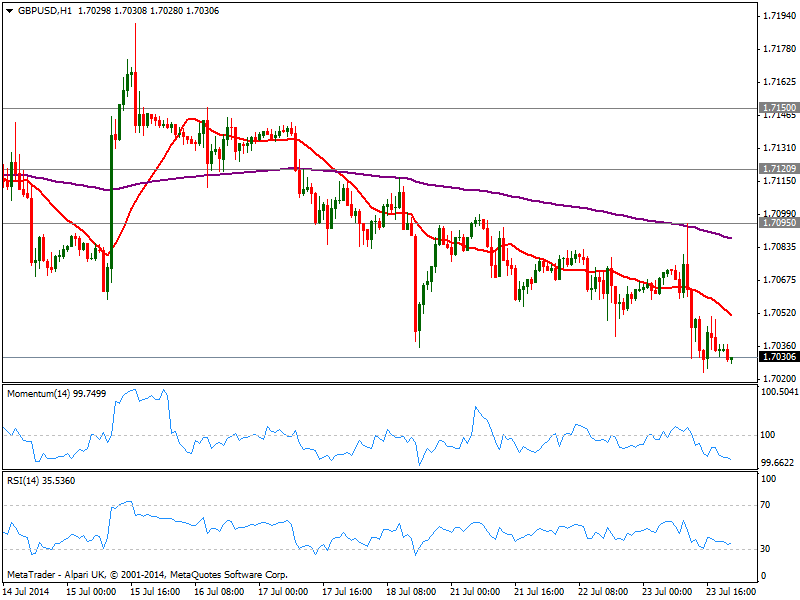
The GBP/USD eased from a daily high of 1.7095 on the back of a dovish BOE, as the Central Bank not only kept the usual vote unchanged, but governor Carney asseverated there’s no actual date for a rate hike. Nevertheless, the pair was unable to break below 1.7030 static support where it stands, maintaining an overall short term tone: the hourly chart shows 20 SMA gaining bearish momentum above current price while indicators support a break lower. In the 4 hours chart, price stands a few pips below its 200 EMA, unable to extend its decline. Having posted a daily low of 1.7020, a price acceleration below the level should support a downward extension towards 1.6950, with only a recovery above mentioned 1.7095 reversing the negative tone.
Support levels: 1.7020 1.6985 1.6950
Resistance levels: 1.7050 1.7095 1.7120
USD/JPY Current price: 101.53
View Live Chart for the USD/JPY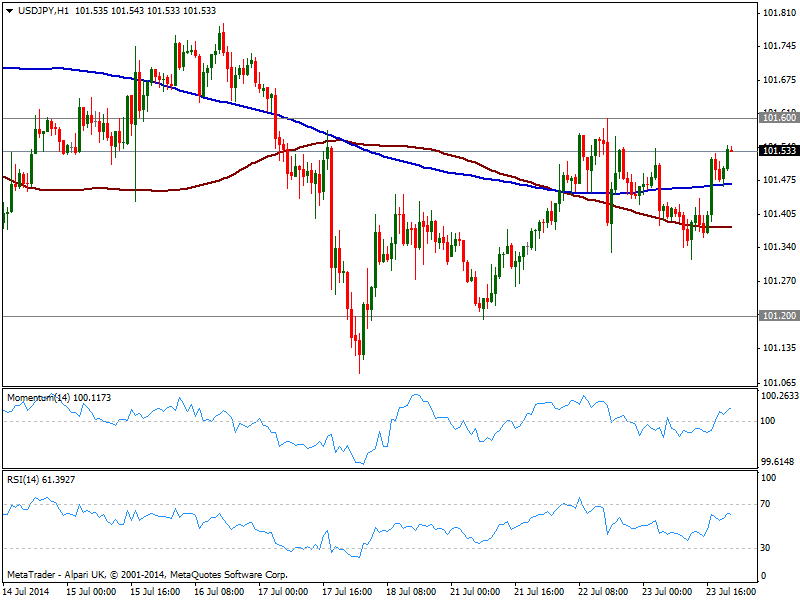
The USD/JPY traded within range, up on the day but still shy of 101.60 immediate resistance. The hourly chart shows indicators heading higher above their midlines, and price finding short term support at its 200 SMA, albeit moving averages are horizontal, and with price moving back and forth around them, have become less reliable. In the 4 hours chart indicators head higher in positive territory, yet chances of an advance are subdue to a break above mentioned resistance.
Support levels: 101.20 101.05 100.70
Resistance levels: 101.60 101.95 102.35
AUD/USD Current price: 0.9452
View Live Chart for the AUD/USD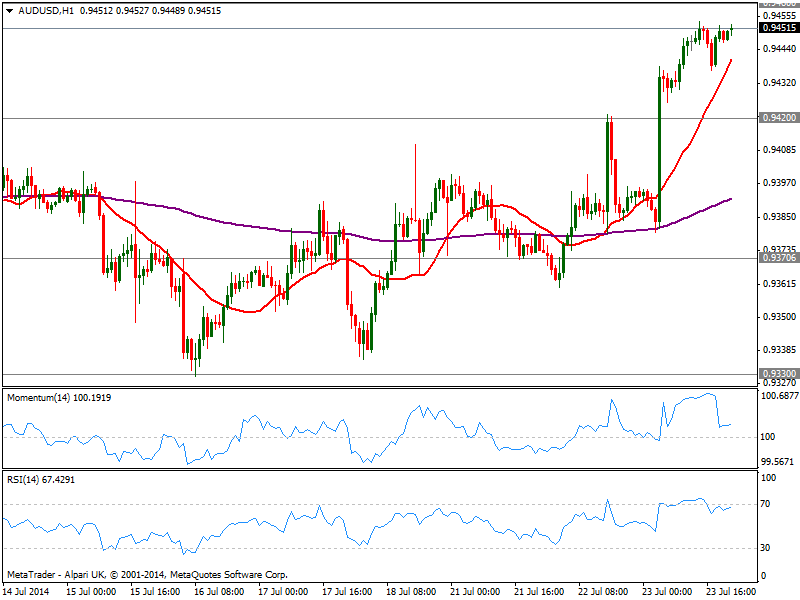
Aussie was the star of the day, soaring on local rising inflation and extending its advance all through the day. The AUD/USD approaches 0.9460 early Asian session, strong static resistance level, while the hourly chart shows indicators already corrected overbought readings and regain the upside, while 20 SMA heads strongly up below current price. In the 4 hours chart indicators start looking exhausted to the upside, losing their upward potential and turning flat near overbought levels. Nevertheless, further advances beyond 0.9460 should signal an upward continuation, and a quick test of 0.9500 figure. Bulls will maintain the lead as long as price holds above 0.9420 support.
Support levels: 0.9420 0.9370 0.9330
Resistance levels: 0.9460 0.9500 0.9540
Recommended Content
Editors’ Picks
EUR/USD clings to daily gains above 1.0650

EUR/USD gained traction and turned positive on the day above 1.0650. The improvement seen in risk mood following the earlier flight to safety weighs on the US Dollar ahead of the weekend and helps the pair push higher.
GBP/USD recovers toward 1.2450 after UK Retail Sales data

GBP/USD reversed its direction and advanced to the 1.2450 area after touching a fresh multi-month low below 1.2400 in the Asian session. The positive shift seen in risk mood on easing fears over a deepening Iran-Israel conflict supports the pair.
Gold holds steady at around $2,380 following earlier spike

Gold stabilized near $2,380 after spiking above $2,400 with the immediate reaction to reports of Israel striking Iran. Meanwhile, the pullback seen in the US Treasury bond yields helps XAU/USD hold its ground.
Bitcoin Weekly Forecast: BTC post-halving rally could be partially priced in Premium

Bitcoin price shows no signs of directional bias while it holds above $60,000. The fourth BTC halving is partially priced in, according to Deutsche Bank’s research.
Week ahead – US GDP and BoJ decision on top of next week’s agenda

US GDP, core PCE and PMIs the next tests for the Dollar. Investors await BoJ for guidance about next rate hike. EU and UK PMIs, as well as Australian CPIs also on tap.