EUR/USD Current price: 1.3644
View Live Chart for the EUR/USD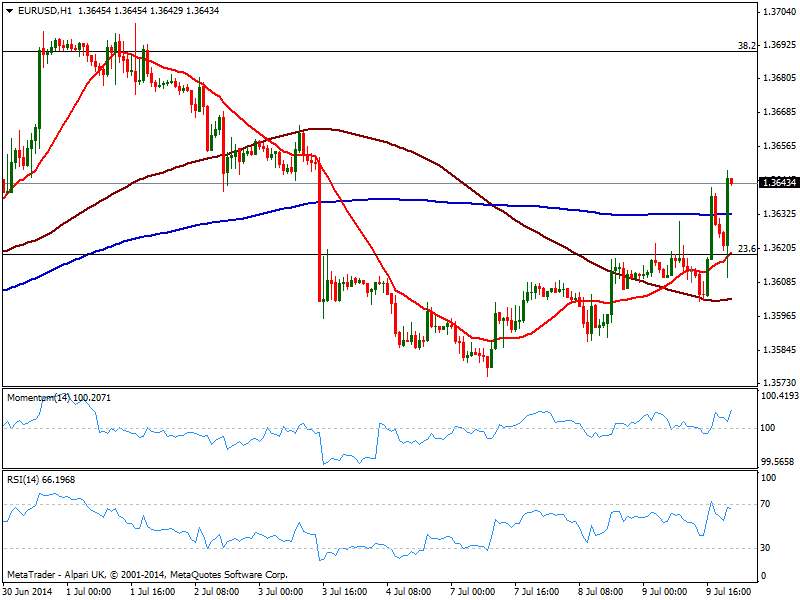
FOMC Minutes are out after a long day of waiting, announcing what most market participants suspected, but needed to confirm: tapering may end with a 15B cut in October if the economic outlook holds, but said nothing about rates. So the easing era may be at its end for the US, but the rising rates one has not yet have a date. The Minutes also said that while growth suffered at the beginning of the year, has started to pick up, but that’s not enough to trigger a dollar rally: market players may now realize the end of QE does not mean the country is ready to raise rates.
The EUR/USD advanced up to 1.3642 early US opening, on the back of a stock recovery across the world: European indexes closed mostly up, while US are in green after two days of selling. Initial market reaction saw the pair edging down to 1.3610 from where it quickly bounced back above mentioned daily high. The upward potential seems a bit more constructive now in the short term, with the hourly chart showing price advancing above its 20 SMA as indicators head north above their midlines. In the 4 hours chart technical readings gain also upward tone, with price now struggling to overcome 1.3645, intermediate resistance. Once above, next resistance area comes at 1.3680/1.3700 where a Fibonacci level converges with recent highs.
Support levels: 1.3610 1.3570 1.3530
Resistance levels: 1.3645 1.3675 1.3700
EUR/JPY Current price: 138.58
View Live Chart for the EUR/JPY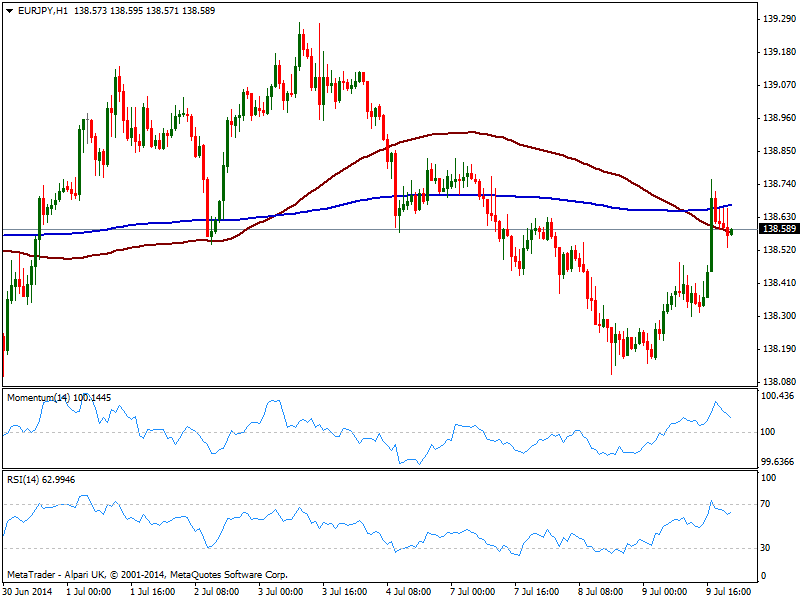
The EUR/JPY managed to post some intraday gains, retracing now from a fresh 2-day high of 138.75. Yields are slightly up after the news nothing impressive, with the yen also advancing against the greenback and leaving the cross under mild pressure. The hourly chart shows price stalled around its 200 SMA currently at 138.70 as indicators turn lower near overbought levels. In the 4 hours chart the outlook is a bit more positive as indicators head north and are about to cross their midlines. If the pair ever had a chance of recovering the upside, today’s the day: some upward momentum in Asian share markets may be supportive of a bearish yen, and a test of 139.00 price zone seems likely. Nevertheless a break above it is required to confirm further advances towards 140.40 in the upcoming days.
Support levels: 138.40 137.90 137.40
Resistance levels: 138.90 139.35 139.80
GBP/USD Current price: 1.7153
View Live Chart for the GBP/USD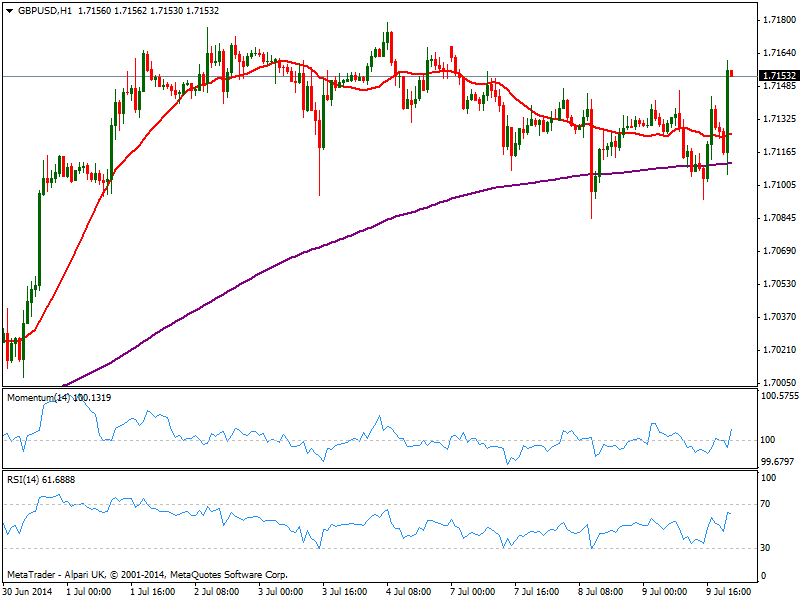
Pound extends its advance up to 1.7160 in the American afternoon, turning positive on the day. The lack of news in the UK and Europe left the pair at the mercy of stocks and dollar earlier on the day, but again the GBP/USD found buyers on approaches to the 1.7095 static support and seems now ready to resume the upside. The hourly chart shows price recovered above its 20 SMA while indicators turned positive above their midlines. In the 4 hours chart price overcame its 20 SMA and indicators aim higher, still in neutral territory. Immediate resistance stands at 1.7180 this year high, with a break above it exposing 1.7250 midterm resistance.
Support levels: 1.7140 1.7095 1.7060
Resistance levels: 1.7180 1.7220 1.7250
USD/JPY Current price: 101.56
View Live Chart for the USD/JPY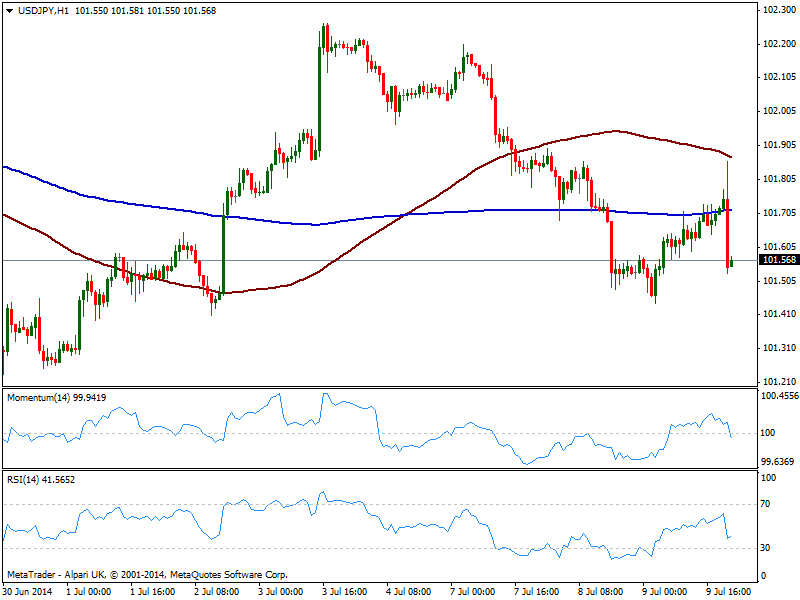
A recovery attempt in THE USD/JPY stalled at 101.85 where price found its 100 SMA in the hourly chart, and quickly turned south back below 101.60. The hourly chart shows an increasing bearish momentum coming from indicators heading south below their midlines, while the 4 hours chart shows indicators also turning south in negative territory, and price well below moving averages. Immediate support still stands at 101.20 and once broken, a retest of the year low around 100.70 seems likely. Advances are seen as selling opportunities, up to 102.35 price zone.
Support levels: 101.60 101.20 100.70
Resistance levels: 101.95 102.35 102.80
AUD/USD Current price: 0.9418
View Live Chart for the AUD/USD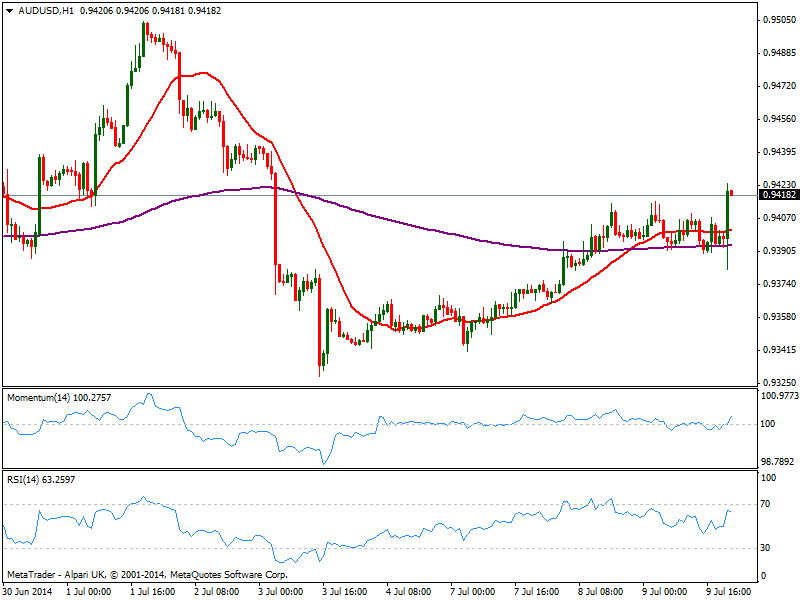
The AUD/USD struggles to overcome 0.9420 resistance, posting its fourth day in a row with gains. Australian employment figures will be released over Asian session, and indeed will bring some action in the pair, as a positive reading may see current recovery extending up to 0.9460 in route to the 0.9500 figure. Technically the hourly chart shows an increasing upward momentum, still a bit shy as price extends above a flat 20 SMA. In the 4 hours chart indicators look still messy but in positive territory, not yet defining a clear direction, although price managed to bounce strongly from a bullish 20 SMA supporting and advance in the pair for the upcoming hours.
Support levels: 0.9370 0.9330 0.9300
Resistance levels: 0.9420 0.9460 0.9500
Recommended Content
Editors’ Picks
AUD/USD remained bid above 0.6500

AUD/USD extended further its bullish performance, advancing for the fourth session in a row on Thursday, although a sustainable breakout of the key 200-day SMA at 0.6526 still remain elusive.
EUR/USD faces a minor resistance near at 1.0750

EUR/USD quickly left behind Wednesday’s small downtick and resumed its uptrend north of 1.0700 the figure, always on the back of the persistent sell-off in the US Dollar ahead of key PCE data on Friday.
Gold holds around $2,330 after dismal US data

Gold fell below $2,320 in the early American session as US yields shot higher after the data showed a significant increase in the US GDP price deflator in Q1. With safe-haven flows dominating the markets, however, XAU/USD reversed its direction and rose above $2,340.
Bitcoin price continues to get rejected from $65K resistance as SEC delays decision on spot BTC ETF options

Bitcoin (BTC) price has markets in disarray, provoking a broader market crash as it slumped to the $62,000 range on Thursday. Meanwhile, reverberations from spot BTC exchange-traded funds (ETFs) continue to influence the market.
US economy: slower growth with stronger inflation

The dollar strengthened, and stocks fell after statistical data from the US. The focus was on the preliminary estimate of GDP for the first quarter. Annualised quarterly growth came in at just 1.6%, down from the 2.5% and 3.4% previously forecast.