EUR/USD Current price: 1.3809
View Live Chart for the EUR/USD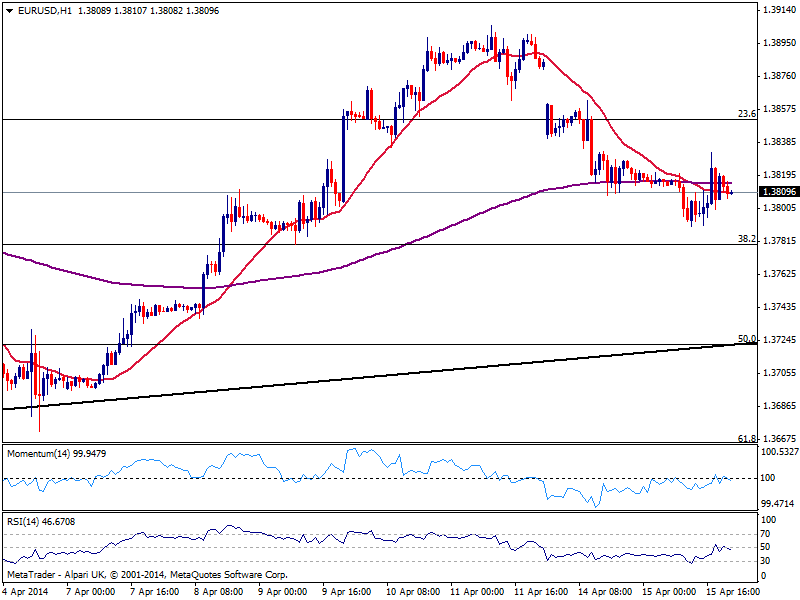
The EUR/USD extended its decline this Tuesday, in a sentiment driven day despite the hurdle of data coming from both sides of the Atlantic. Overall, data resulted mixed triggering some 20 pips spikes here and there either side of the board, thus incapable to define a certain trend for the pair, which hovered around 1.3800 for most of the last two sessions. With the weekly opening gap still unfiled, and buyers waiting on the 1.3780 area, the pair seems pretty well limited to the downside. But the daily chart shows a shooting star from Friday, followed by 2 bearish candles, and a new leg lower on Wednesday may be the third time a charm for bears.
Anyway, and from a technical point of view, the hourly chart shows price moving back and forth around a slightly bearish 20 SMA and indicators steady in neutral territory, reflecting the lack of direction in the pair. In the 4 hours chart, 200 EMA provided intraday support around the daily low of 1.3790, while indicators correct higher, still in negative territory. Sellers are taking their chances in the 1.3820/50 price zone, so only steady gains above this last can deny the dominant bearish short term tone of the pair.
Support levels: 1.3780 1.3750 1.3720
Resistance levels: 1.3820 1.3850 1.3890
EUR/JPY Current price: 140.65
View Live Chart for the EUR/JPY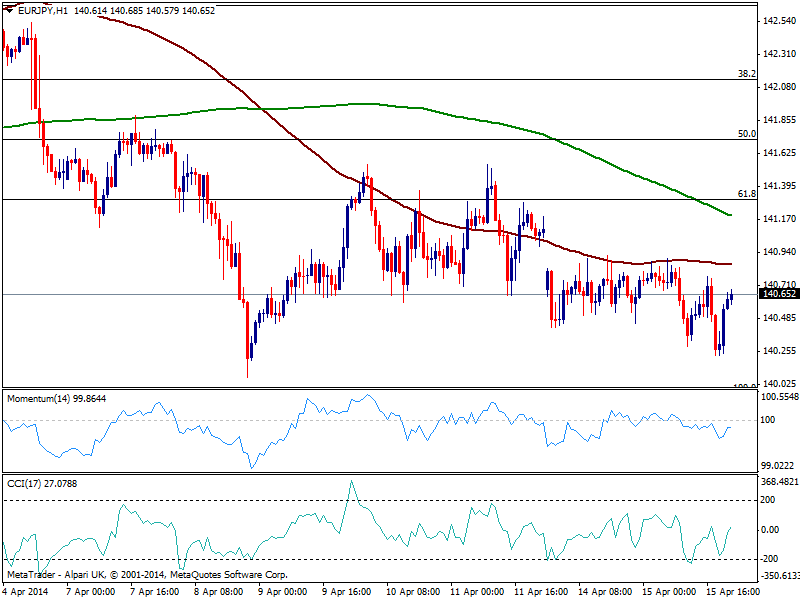
Yen crosses followed stocks blindly, with US indexes leading the way. Nevertheless, the EUR/JPY technical picture continues to be predominantly bearish, as price held below its 100 SMA in the hourly chart, while 200 one decreased further and indicators held in negative territory. Furthermore, the pair established a lower low of 140.22 while in the 4 hours chart indicators retraced from their midlines and head lower in negative territory. As long as below 141.10, the downside is favored with a break below 139.90 required to trigger a bearish run in the short term.
Support levels: 140.40 139.90 139.35
Resistance levels: 141.10 141.50 142.00
GBP/USD Current price: 1.6722
View Live Chart for the GBP/USD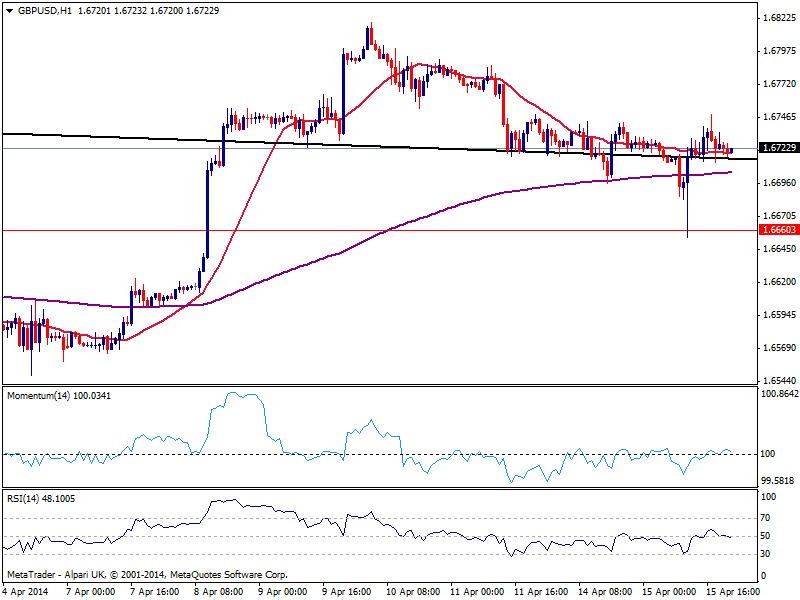
The GBP/USD stands pretty much unchanged from early European levels, boosted by UK housing positive readings, after investor dismissed a small drop in PPI. The pair however, seems unable to extend beyond 1.6740/50 static resistance area, leaving the hourly chart with a neutral outlook ahead of Asian opening, but with price holding steady above the 1.6700/10 area, immediate short term support. In the 4 hours chart the pair erased the negative tone seen on Monday, and indicators grind higher still lacking momentum and mostly around their midlines. However, the upside is favored with a break above afore mentioned resistance required to confirm a retest of the year highs around 1.6820.
Support levels: 1.6710 1.6695 1.6660
Resistance levels: 1.6750 1.6785 1.6820
USD/JPY Current price: 101.81
View Live Chart for the USD/JPY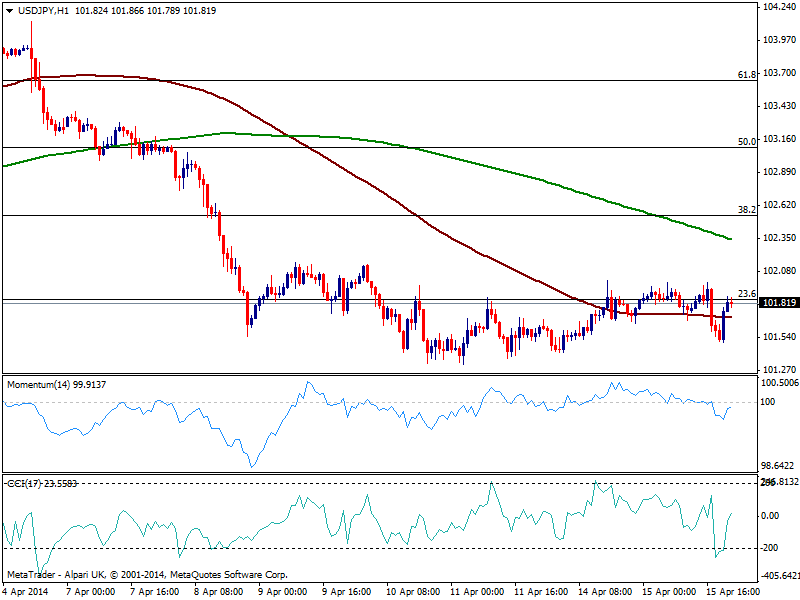
Unchanged since last update, the USD/JPY remains trading below the 102.00 level having recovered from an intraday dip down to 101.50. Little to add to the technical outlook in the short term, the pair remains favored to the downside with a break below 101.20 confirming a new leg down. Above 102.10, next batch of sellers will likely surge on approaches to the 102.60 price zone.
Support levels: 101.55 101.20 100.70
Resistance levels: 102.00 102.35 102.60
AUD/USD Current price: 0.9353
View Live Chart for the AUD/USD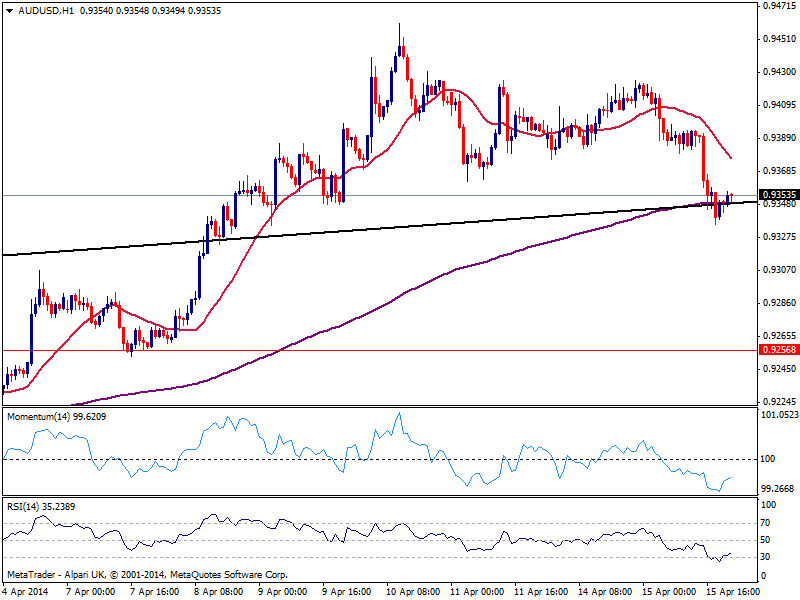
Australian dollar was hit hard by falling gold prices, posting its largest daily fall against the greenback in over 3 weeks, reaching 0.9335 before bouncing back some. The hourly chart however, maintains the negative tone with indicators turning south below their midlines and 20 SMA gaining bearish slope above current price. In the 4 hours chart technical readings also present a strong bearish momentum, with a break below 0.9330 now confirming a downside extension for the upcoming sessions. Chinese GDP data to be release later today, will be the make it or break it for Aussie, at least in the short term.
Support levels: 0.9360 0.9320 0.9290
Resistance levels: 0.9445 0.9485 0.9530
Recommended Content
Editors’ Picks
AUD/USD could extend the recovery to 0.6500 and above

The enhanced risk appetite and the weakening of the Greenback enabled AUD/USD to build on the promising start to the week and trade closer to the key barrier at 0.6500 the figure ahead of key inflation figures in Australia.
EUR/USD now refocuses on the 200-day SMA

EUR/USD extended its positive momentum and rose above the 1.0700 yardstick, driven by the intense PMI-led retracement in the US Dollar as well as a prevailing risk-friendly environment in the FX universe.
Gold struggles around $2,325 despite broad US Dollar’s weakness

Gold reversed its direction and rose to the $2,320 area, erasing a large portion of its daily losses in the process. The benchmark 10-year US Treasury bond yield stays in the red below 4.6% following the weak US PMI data and supports XAU/USD.
Bitcoin price makes run for previous cycle highs as Morgan Stanley pushes BTC ETF exposure

Bitcoin (BTC) price strength continues to grow, three days after the fourth halving. Optimism continues to abound in the market as Bitcoiners envision a reclamation of previous cycle highs.
US versus the Eurozone: Inflation divergence causes monetary desynchronization

Historically there is a very close correlation between changes in US Treasury yields and German Bund yields. This is relevant at the current juncture, considering that the recent hawkish twist in the tone of the Federal Reserve might continue to push US long-term interest rates higher and put upward pressure on bond yields in the Eurozone.