EUR/USD Current price: 1.3817
View Live Chart for the EUR/USD
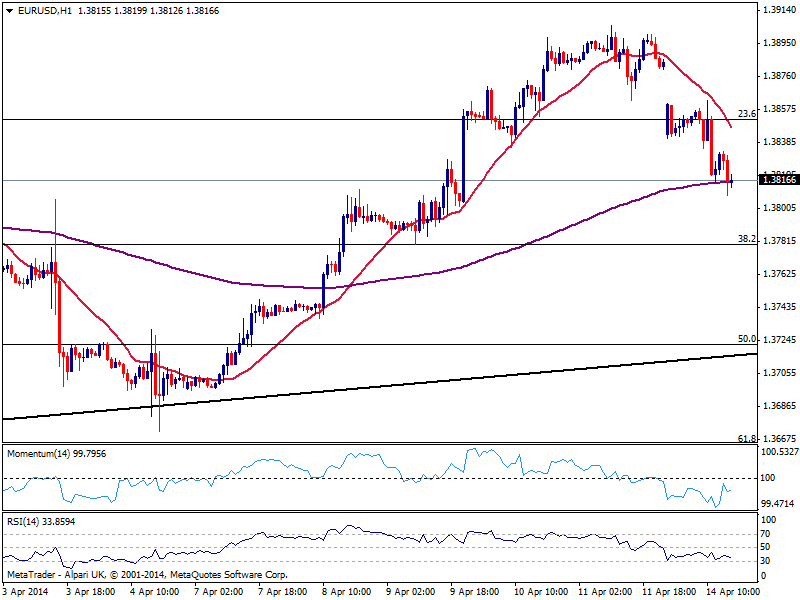
The dollar got a boost from better than expected US Retail Sales readings, extending its intraday decline to a daily low of 1.3807, already under pressure albeit ECB jawboning over the weekend. Nevertheless, dollar gains remain limited, as the American currency is giving up ground early US session. As for the EUR/USD technical picture, the hourly chart shows price well above its 20 SMA that gains bearish slope above current price, while indicators head lower below their midlines. In the 4 hours chart technical readings stand also in negative territory, albeit losing their downward potential, limiting for now the downside. A break below the daily low may see the pair extending its slide, albeit buyers will likely surge on approaches to 1.3780 static support.
Support levels: 1.3810 1.3780 1.3750
Resistance levels: 1.3850 1.3890 1.3920
GBP/USD Current price: 1.6719
View Live Chart for the GBP/USD
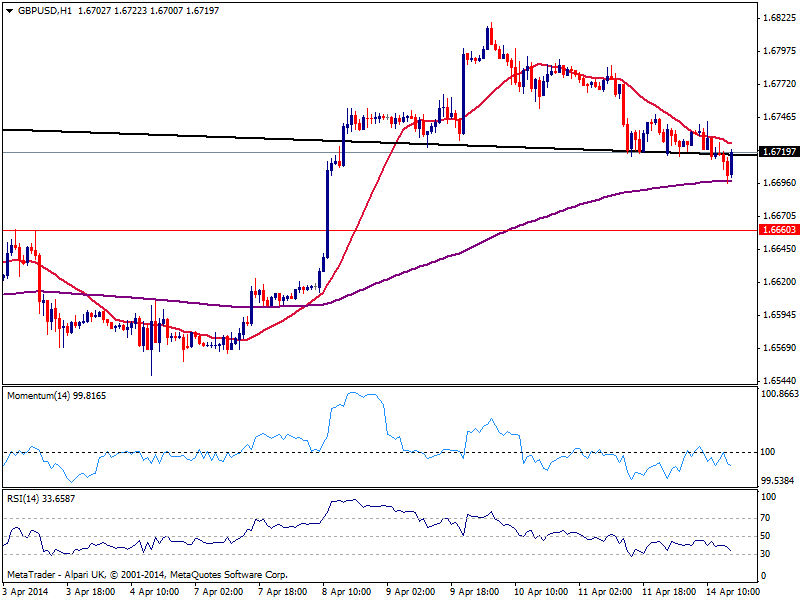
The GBP/USD bounces from a daily low of 1.6696, struggling now to recover above the daily descendant trend line coming from this year high, and with the hourly chart showing price still below a bearish 20 SMA and indicators heading south in negative territory. In the 4 hours chart the technical picture remains strongly bearish, with immediate resistance now in the 1.6750 price zone, as per several intraday highs and lows around it: price needs to extend beyond this level to be able to extend its recovery, albeit seems pretty unlikely on this slowmo Monday.
Support levels: 1.6695 1.6660 1.6625
Resistance levels: 1.6750 1.6785 1.6820
USD/JPY Current price: 101.88
View Live Chart for the USD/JPY
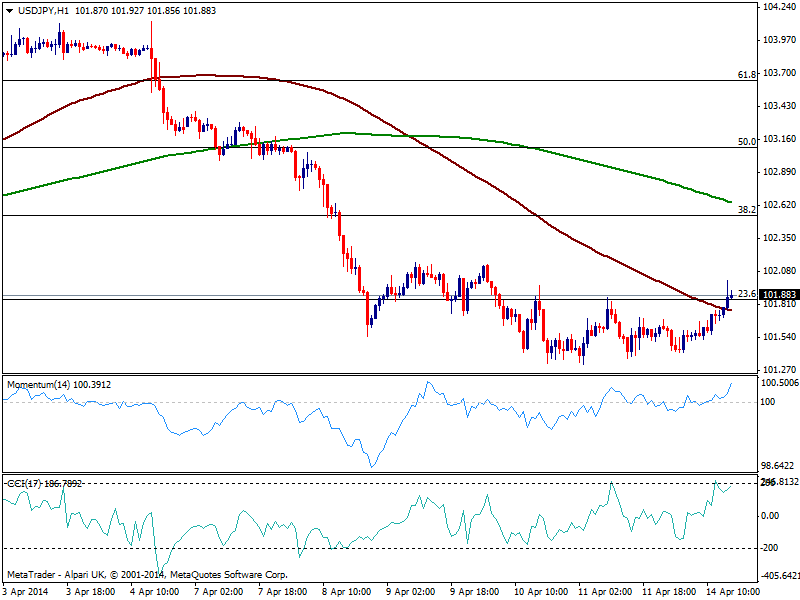
The USD/JPY jumped up to 102.00 from where the pair is now retracing after faltering to overcome the key figure, presenting a limited upward potential in the hourly chart: price holds above a still bearish 100 SMA while indicators aim higher above their midlines. In the 4 hours chart technical readings present also a bullish tone, albeit unless a clear advance beyond mentioned 102.00 level, sellers will likely remain in control.
Support levels: 101.20 100.70 100.30
Resistance levels: 102.00 102.35 102.60
AUD/USD Current price: 0.9410
View Live Chart for the AUD/USD
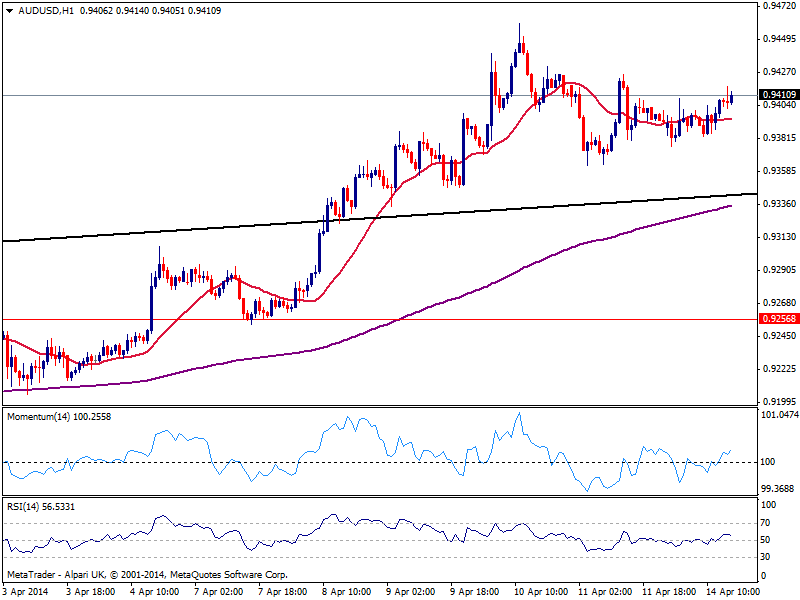
Australian recovered against the greenback above the 0.9400 mark, holding above the level with positive US stocks opening. The hourly chart shows a mild positive tone with indicators flat above their midlines and price advancing above an also flat 20 SMA. In the 4 hours chart technical indicators maintain a quite neutral stance, as per being flat around their midlines, showing not much strength at the time being: price needs to advance beyond 0.9445 to resume the upside, and will probably take until upcoming Asian session and positive Chinese data to do so.
Support levels: 0.9360 0.9320 0.9290
Resistance levels: 0.9445 0.9485 0.9530
Recommended Content
Editors’ Picks
AUD/USD failed just ahead of the 200-day SMA

Finally, AUD/USD managed to break above the 0.6500 barrier on Wednesday, extending the weekly recovery, although its advance faltered just ahead of the 0.6530 region, where the key 200-day SMA sits.
EUR/USD met some decent resistance above 1.0700

EUR/USD remained unable to gather extra upside traction and surpass the 1.0700 hurdle in a convincing fashion on Wednesday, instead giving away part of the weekly gains against the backdrop of a decent bounce in the Dollar.
Gold keeps consolidating ahead of US first-tier figures

Gold finds it difficult to stage a rebound midweek following Monday's sharp decline but manages to hold above $2,300. The benchmark 10-year US Treasury bond yield stays in the green above 4.6% after US data, not allowing the pair to turn north.
Bitcoin price could be primed for correction as bearish activity grows near $66K area

Bitcoin (BTC) price managed to maintain a northbound trajectory after the April 20 halving, despite bold assertions by analysts that the event would be a “sell the news” situation. However, after four days of strength, the tables could be turning as a dark cloud now hovers above BTC price.
Bank of Japan's predicament: The BOJ is trapped

In this special edition of TradeGATEHub Live Trading, we're joined by guest speaker Tavi @TaviCosta, who shares his insights on the Bank of Japan's current predicament, stating, 'The BOJ is Trapped.'


