EUR/USD Current price: 1.2475
View Live Chart for the EUR/USD
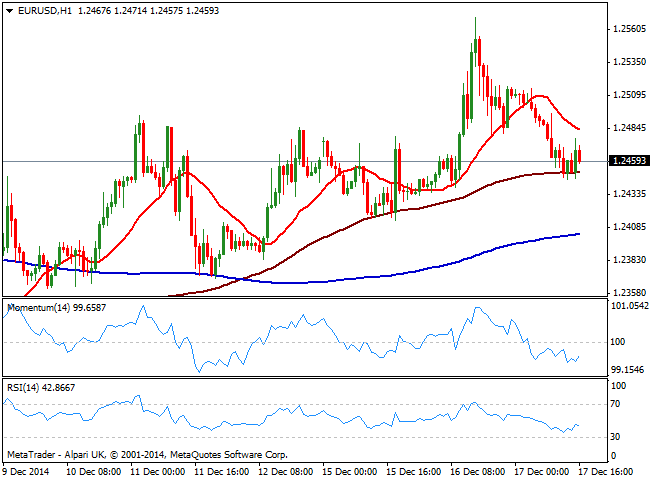
The EUR/USD pair bounced from a daily low of 1.2445 following weaker than expected inflation readings in the US. CPI missed expectations, with the YoY reading at 1.3% and Nov figure at -0.3%, down on energy costs, no surprise considering oil lost 45% of its value in the last 6 months. However, things may not be as bad as the headline suggest, as according to latest NFP data, hourly wages increased meaning real wages actually increased as a result. The 1 hour chart shows however that the price remains limited to the upside by a bearish 20 SMA around 1.2485 while indicators diverge from each other but remain in negative territory. In the 4 hours chart price continues to struggle around its 20 SMA whilst indicators rest directionless in neutral territory. At this point is all about the FED and the wording of its statement, and a break below 1.2400 or above 1.2485 will likely set the tone after the news.
Support levels: 1.2440 1.2400 1.2360
Resistance levels: 1.2485 1.2530 1.2570
GBP/USD Current price: 1.5704
View Live Chart for the GBP/USD
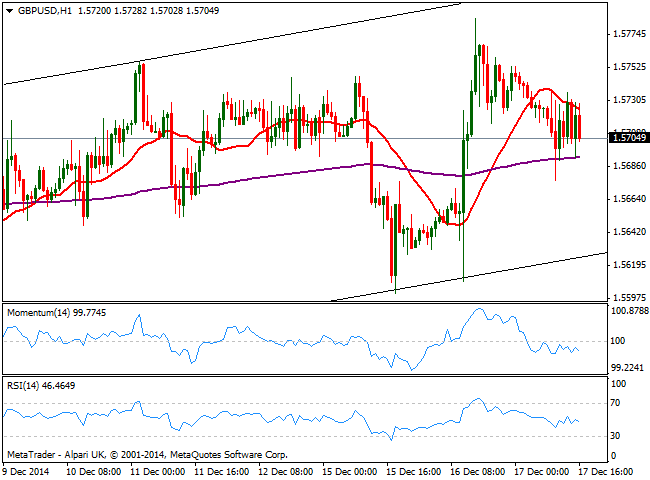
The GBP/USD pair trades in a quiet range ever since the European opening, having found little support in rising wages and steady unemployment. The pair seems attached to the 1.5700 level, with the 1 hour chart showing the price unable to advance above a bullish 20 SMA and indicators heading lower below their midlines, keeping the pressure to the downside. In the 4 hours chart technical readings present a neutral stance, with 20 SMA flat and indicators turning lower around their midlines. The pair develops inside an ascendant channel which base stands now at 1.5630, critical support to follow during the upcoming hours, as a break below should increase the downward pressure.
Support levels: 1.5670 1.5630 1.5590
Resistance levels: 1.5740 1.5785 1.5825
USD/JPY Current price: 117.04
View Live Chart for the USD/JPY
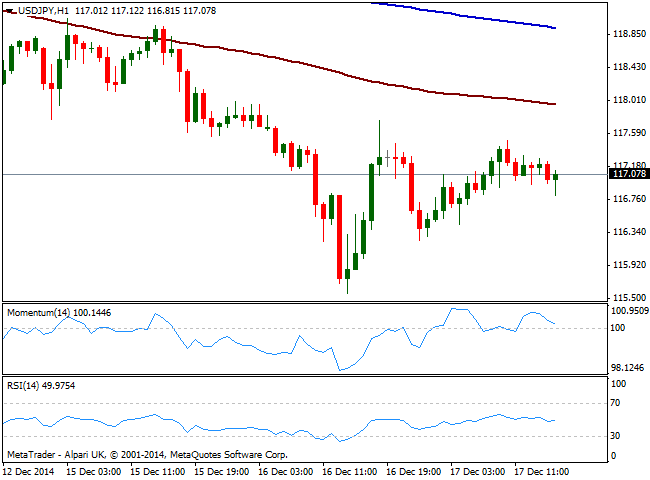
The USD/JPY pair consolidates around the 117.00 figure, steady as stocks halt these last days bleeding, but unable to run. The 1 hour chart shows that the price remains below its 100 and 200 SMAs, both with a clear bearish slope, while momentum turned lower but remains above 100. In the 4 hours chart indicators corrected oversold readings and stand flat below their midlines, reflecting current lack of direction in the price.
Support levels: 116.90 116.60 116.25
Resistance levels: 117.30 117.75 118.20
AUD/USD Current price: 0.8181
View Live Chart of the AUD/USD
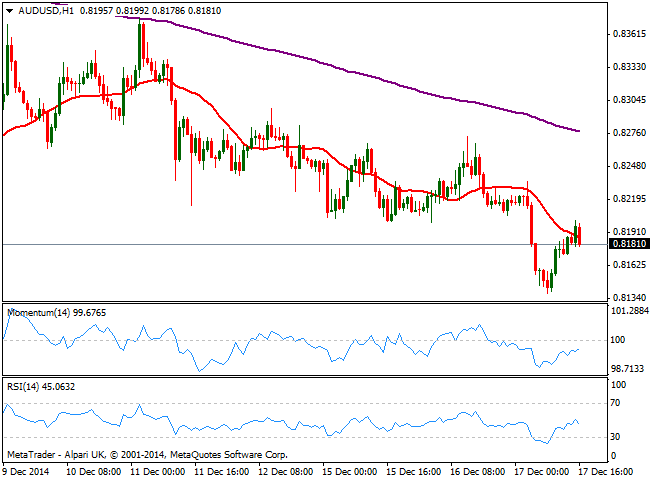
The AUD/USD pair fell to a fresh multi-year low of 0.8138 during Asian hours, with no actual catalyst behind the slide but the strong ongoing bearish trend. Technically, the 1 hour chart shows the upward corrective movement following the mentioned low, found sellers around the 0.8200 figure, now immediate resistance. Indicators had corrected oversold readings but remain weak in negative territory as price hovers around its 20 SMA. In the 4 hours chart technical readings are biased lower, favoring further declines in the longer term regardless whatever happens with the FOMC today.
Support levels: 0.8140 0.8110 0.8075
Resistance levels: 0.8200 0.8230 0.8270
Recommended Content
Editors’ Picks
AUD/USD stands firm above 0.6500 with markets bracing for Aussie PPI, US inflation

The Aussie Dollar begins Friday’s Asian session on the right foot against the Greenback after posting gains of 0.33% on Thursday. The AUD/USD advance was sponsored by a United States report showing the economy is growing below estimates while inflation picked up. The pair traded at 0.6518.
EUR/USD faces a minor resistance near at 1.0750

EUR/USD quickly left behind Wednesday’s small downtick and resumed its uptrend north of 1.0700 the figure, always on the back of the persistent sell-off in the US Dollar ahead of key PCE data on Friday.
Gold soars as US economic woes and inflation fears grip investors

Gold prices advanced modestly during Thursday’s North American session, gaining more than 0.5% following the release of crucial economic data from the United States. GDP figures for the first quarter of 2024 missed estimates, increasing speculation that the US Fed could lower borrowing costs.
Bitcoin price continues to get rejected from $65K resistance as SEC delays decision on spot BTC ETF options

Bitcoin (BTC) price has markets in disarray, provoking a broader market crash as it slumped to the $62,000 range on Thursday. Meanwhile, reverberations from spot BTC exchange-traded funds (ETFs) continue to influence the market.
US economy: Slower growth with stronger inflation

The dollar strengthened, and stocks fell after statistical data from the US. The focus was on the preliminary estimate of GDP for the first quarter. Annualised quarterly growth came in at just 1.6%, down from the 2.5% and 3.4% previously forecast.