EUR/USD Current price: 1.2479
View Live Chart for the EUR/USD
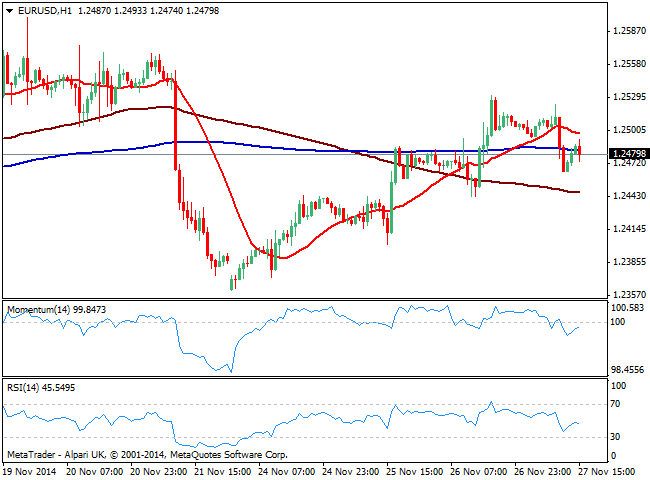
The EUR/USD pair lost the 1.2500 level during the European session, following mixed releases in the EZ, among which the most relevant resulted to be Draghi’s words before the finish parliament, pointing out QE is indeed available, albeit latest measures still need time to work out: in plain english, no action expected for next week coming from the ECB. German inflation readings also disappointed, printing 0.00% monthly basis, and diluting partially latest optimism regarding the economy. With the US closed today on Thanksgiving, there’s little to expect from majors during the rest of the day. Short term, the EUR/USD 1 hour chart shows price below its 20 SMA and indicators directionless below their midlines, while the 4 hours chart maintains the mild positive tone, with price recovering from a daily low of 1.2464 and above a bullish 20 SMA as indicators hold also lacking directional strength, above their midlines.
Support levels: 1.2440 1.2400 1.2360
Resistance levels: 1.2520 1.2555 1.2600
GBP/USD Current price: 1.5746
View Live Chart for the GBP/USD
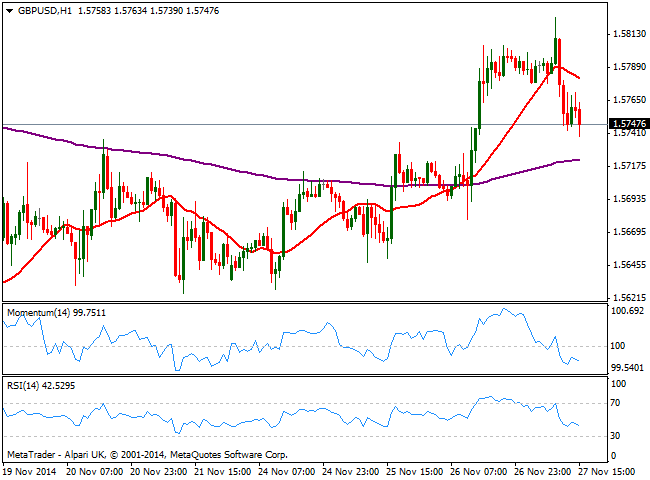
The GBP/USD pair eased from a fresh 11-day high of 1.5825, now pressuring the top of these last 2-week range around 1.5740. With no local data, Pound slide has been attributed to dollar short term momentum after Draghi’s words. Technically, the 1 hour chart shows an increasing bearish potential, with price below its 20 SMA and indicators heading lower well below their midlines. In the 4 hours chart 20 SMA maintains its bullish slope currently around 1.5710, while indicators stand flat in positive territory. Further declines below 1.5740 should deny chances of a firmer advance rather than suggest a continued slide for today.
Support levels: 1.5740 1.5700 1.5660
Resistance levels: 1.5770 1.5825 1.5860
USD/JPY Current price: 117.54
View Live Chart for the USD/JPY
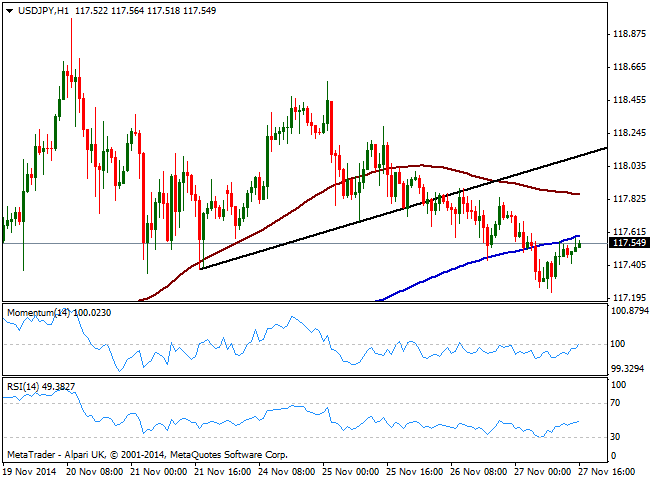
Yen advanced against the greenback, dragging USD/JPY to a daily low of 117.23, from where the pair bounced during the European morning. Still subdued, the 1 hour chart shows price now below 200 SMA while indicators aim higher below their midlines, limiting the upside. In the 4 hours chart indicators head lower having been rejected from their midlines, which maintains the bearish bias alive.
Support levels: 117.35 117.00 116.65
Resistance levels: 117.95 118.40 118.90
AUD/USD Current price: 0.8562
View Live Chart of the AUD/USD
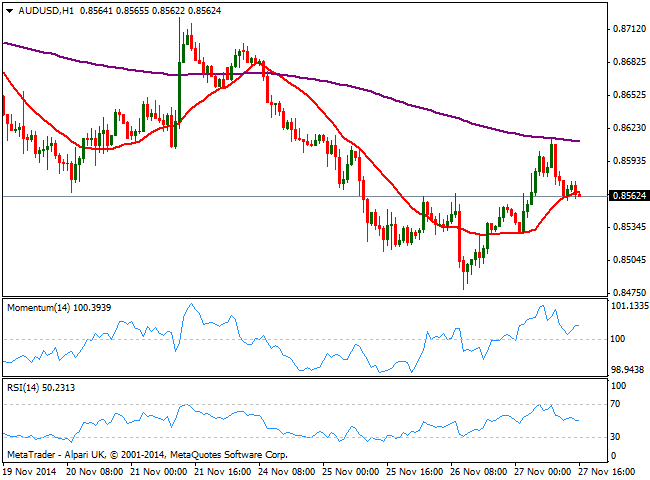
Australian dollar recovered over Asian hours, reaching 0.8614 against the greenback, as local Private Capital Expenditures beat expectations, yet the dominant trend prevailed and sellers took their chances: the pair trades back in its mid 0.85, with the 1 hour chart showing price now hovering around a flat 20 SMA and indicators diverging from each other above their midlines. In the 4 hours chart however, indicators barely corrected oversold readings and turned back south in negative territory, while 20 SMA maintains its bearish slope, supporting the dominant bearish trend.
Support levels: 0.8530 0.8500 0.8470
Resistance levels: 0.8580 0.8620 0.8645
Recommended Content
Editors’ Picks
AUD/USD failed just ahead of the 200-day SMA

Finally, AUD/USD managed to break above the 0.6500 barrier on Wednesday, extending the weekly recovery, although its advance faltered just ahead of the 0.6530 region, where the key 200-day SMA sits.
EUR/USD met some decent resistance above 1.0700

EUR/USD remained unable to gather extra upside traction and surpass the 1.0700 hurdle in a convincing fashion on Wednesday, instead giving away part of the weekly gains against the backdrop of a decent bounce in the Dollar.
Gold keeps consolidating ahead of US first-tier figures

Gold finds it difficult to stage a rebound midweek following Monday's sharp decline but manages to hold above $2,300. The benchmark 10-year US Treasury bond yield stays in the green above 4.6% after US data, not allowing the pair to turn north.
Ethereum suffers slight pullback, Hong Kong spot ETH ETFs to begin trading on April 30

Ethereum suffered a brief decline on Wednesday afternoon despite increased accumulation from whales. This follows Ethereum restaking protocol Renzo restaked ETH crashing from its 1:1 peg with ETH and increased activities surrounding spot Ethereum ETFs.
Dow Jones Industrial Average hesitates on Wednesday as markets wait for key US data

The DJIA stumbled on Wednesday, falling from recent highs near 38,550.00 as investors ease off of Tuesday’s risk appetite. The index recovered as US data continues to vex financial markets that remain overwhelmingly focused on rate cuts from the US Fed.