EUR/USD Current price: 1.2433
View Live Chart for the EUR/USD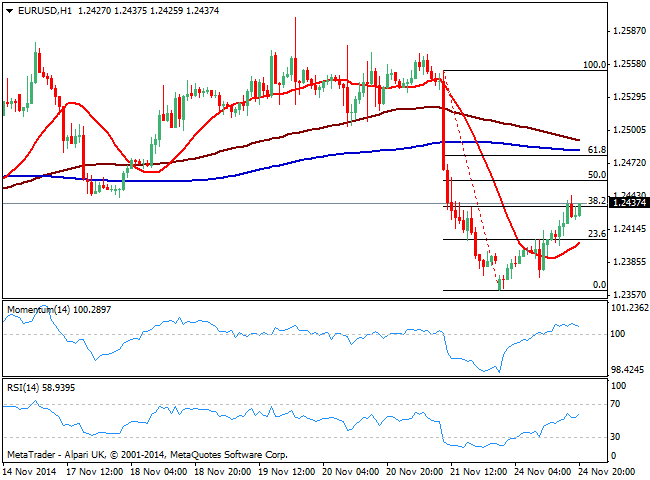
Following a weak opening, the EUR/USD pair has managed to recover some of last Friday’s losses, trading late US afternoon around the 38.2% retracement of the slide triggered by ECB Draghi’s comments by the ends of last week in the 1.2430/40 region. From the fundamental side, German IFO survey showed confidence rose in the country for first time in 7 months giving the pair an early boost. As the day went back, US data missed expectations, with Markit Services PMI printing 56.3 against 56.8 expected and 57.1 previous, extending greenback losses against its American rivals.
Technically, the 1 hour chart shows a mild positive tone coming from technical readings, with 20 SMA turning higher below current price and nearing the 23.6% retracement of the same rally around 1.2405, while indicators stand directionless above their midlines. In the 4 hours chart indicators extended their advance from oversold territory but hold below their midlines, while 20 SMA maintains a bearish slope, converging with the 61.8% retracement of the same slide at 1.2477. This last is then the critical resistance to overcome to see the pair extending their intraday gains on Tuesday, whilst a break below 1.2400 should see it retesting this year lows around 1.2360.
Support levels: 1.2360 1.2325 1.2280
Resistance levels: 1.2480 1.2520 1.2550
EUR/JPY Current price: 147.14
View Live Chart for the EUR/JPY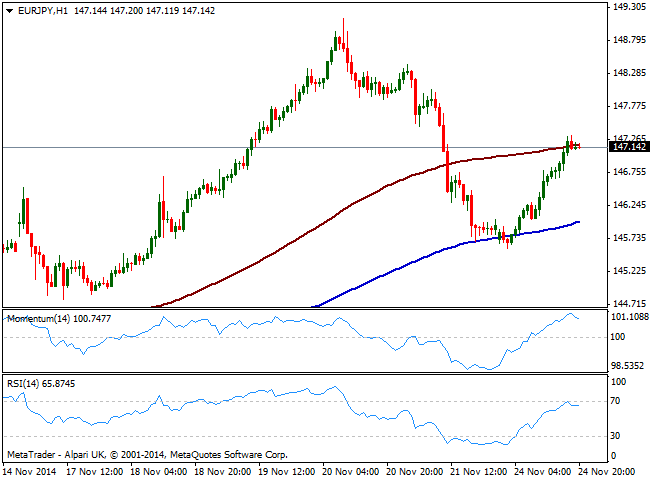
With Japan closed on Monday due to Labor Thanksgiving holiday, yen crosses managed to advance all through the day, sending EUR/JPY back above the 147.00 figure. The rally was also supported by rising stocks all across the world, with mixed closes in Europe and shy gains in US indexes. Technically, the pair has found short term resistance in its 1 hour 100 SMA around current levels, with 200 SMA offering now support around 145.90. Indicators in the mentioned timeframe look exhausted to the upside, presenting a limited retracement from overbought levels, not yet supporting a downward move. In the 4 hours chart momentum heads higher below 100 whilst RSI crossed above 50 and maintains the bullish slope, supporting some further recoveries towards 147.65, immediate resistance level.
Support levels: 146.95 146.40 145.90
Resistance levels: 147.65 148.10 148.65
GBP/USD Current price: 1.5696
View Live Chart for the GBP/USD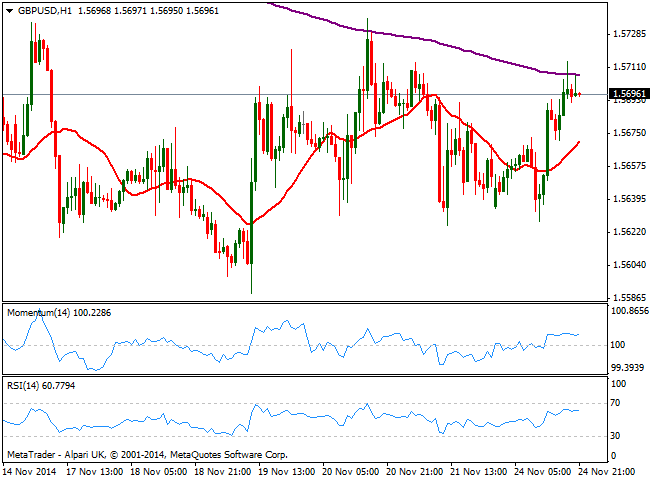
The GBP/USD post some limited gains, but held within its recent range, as there was no data to lead the UK currency. In fact the pair has been likely waiting for Tuesday, when BOE’s governor and other MPC members will testify on inflation before the Parliament’s Treasury Committee, and investors will be paying attention to the wording and any clues on upcoming rate hikes. Technically, the short term picture is neutral to bullish according to the 1 hour chart, as price stands above a mild bullish 20 SMA while indicators stand flat above their midlines. In the 4 hours chart price moves back and forth around a flat 20 SMA while indicators remain in neutral territory. The top of the last 7 days’ range stands at 1.5740 immediate resistance, followed by 1.5770 strong static resistance level: it will take some steady gains above this last to see the pair regaining the upside, with a firmer tone.
Support levels: 1.5650 1.5610 1.5585
Resistance levels: 1.5740 1.5770 15820
USD/JPY Current price: 118.28
View Live Chart for the USD/JPY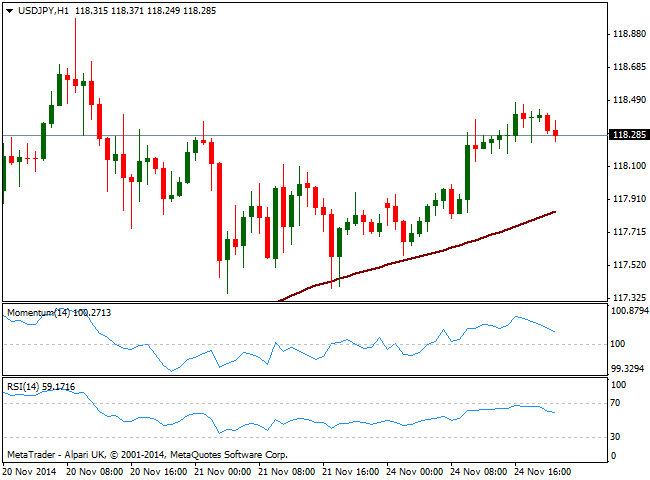
The USD/JPY pair traded uneventfully during the last US session, having however advanced earlier on the day up to 118.48. A mild advance in stocks and steady 10y US yields helped the latest standby mode of the pair that anyway holds to its long term bullish trend, considering daily basis, the pair has posted a higher high and a higher low. Technically, the short term picture shows price above a bullish 100 SMA in the 1 hour chart, while indicators ease some but hold above their midlines. In the 4 hours chart the outlook is neutral to bullish, with momentum hovering around its midline and RSI in the 60 level, while moving averages maintain a strong upward slope well below current price. At this point however, price needs to extend above the 119.00 figure to trigger another round of strong buying, pointing for a test of the 120.00 figure afterwards.
Support levels: 118.20 117.70 117.45
Resistance levels: 118.60 119.00 119.40
AUD/USD Current price: 0.8611
View Live Chart of the AUD/USD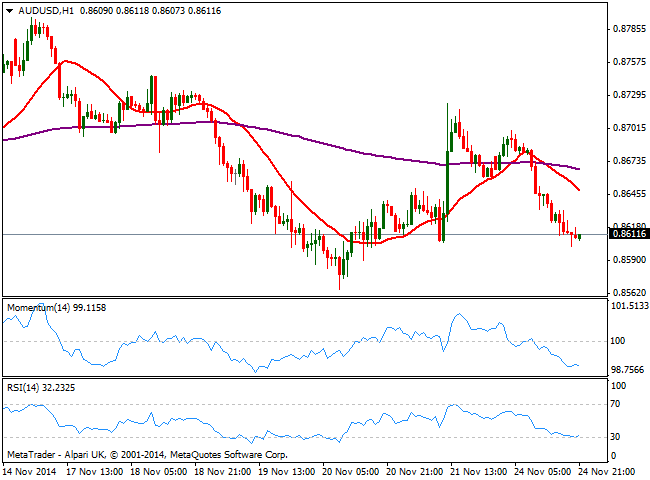
The AUD/USD pair has been under selling pressure during this first day of the week, flirting with the 0.8600 figure in the American afternoon, unable to bounce. The pair has then erased all the gains achieved last Friday after the surprise rate cut from China that sent the pair up to 0.8722. Short term, the 1 hour chart shows indicators still heading lower despite in oversold territory, whilst 20 SMA presents a strong bearish slope well above current levels, in the 0.8650/60 price zone. In the 4 hours chart price extended below a bearish 20 SMA while indicators turned strongly south albeit momentum remains so far above the 100 level. The immediate support stands at 0.8590, and it will take a downward acceleration below the level to confirm a stronger downward continuation, eyeing 0.8550 first and an approach to the 0.8500 figure afterwards.
Support levels: 0.8590 0.8550 0.8510
Resistance levels: 0.8660 0.8700 0.8740
Recommended Content
Editors’ Picks
EUR/USD fluctuates near 1.0700 after US data

EUR/USD stays in a consolidation phase at around 1.0700 in the American session on Wednesday. The data from the US showed a strong increase in Durable Goods Orders, supporting the USD and making it difficult for the pair to gain traction.
USD/JPY refreshes 34-year high, attacks 155.00 as intervention risks loom

USD/JPY is renewing a multi-decade high, closing in on 155.00. Traders turn cautious on heightened risks of Japan's FX intervention. Broad US Dollar rebound aids the upside in the major. US Durable Goods data are next on tap.
Gold keeps consolidating ahead of US first-tier figures

Gold finds it difficult to stage a rebound midweek following Monday's sharp decline but manages to hold above $2,300. The benchmark 10-year US Treasury bond yield stays in the green above 4.6% after US data, not allowing the pair to turn north.
Worldcoin looks set for comeback despite Nvidia’s 22% crash Premium

Worldcoin price is in a better position than last week's and shows signs of a potential comeback. This development occurs amid the sharp decline in the valuation of the popular GPU manufacturer Nvidia.
Three fundamentals for the week: US GDP, BoJ and the Fed's favorite inflation gauge stand out Premium

While it is hard to predict when geopolitical news erupts, the level of tension is lower – allowing for key data to have its say. This week's US figures are set to shape the Federal Reserve's decision next week – and the Bank of Japan may struggle to halt the Yen's deterioration.