EUR/USD Current price: 1.2550
View Live Chart for the EUR/USD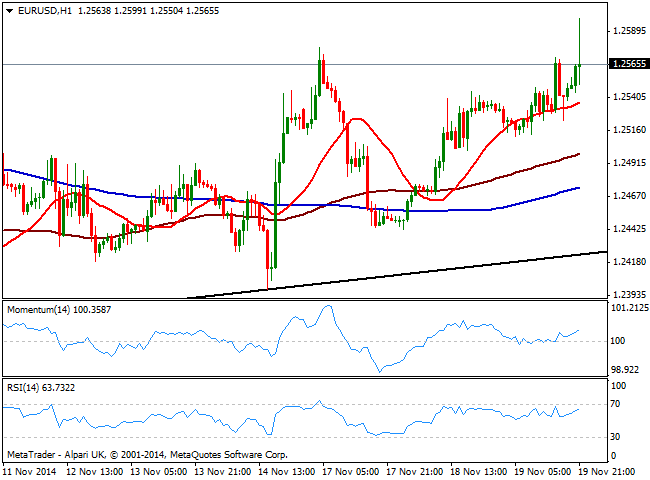
The world is worried about low inflation, and the FED is no exception: ““many participants observed the committee should remain attentive to evidence of a possible downward shift in longer-term inflation expectations,” according to the latest FOMC Minutes, released this US afternoon. The dollar suffered a setback, extending its daily decline against the EUR to 1.2599, although the common currency gains were quickly erased. Nevertheless, the pair not going down either, consolidating around pre news level around 1.2560. Technically the 1 hour chart shows an increasing bullish potential, as per price advancing above its moving averages as indicators grinding higher above their midlines, while the 4 hours chart shows indicators advanced some above their midlines, whilst 20 and 100 SMAs converge around 1.2510, offering strong intraday support. Some further advances should be expected towards 1.2620 immediate short term resistance, in route to 1.2660 strong static resistance zone.
Support levels: 1.2540 1.2500 1.2450
Resistance levels: 1.2620 1.2660 1.2700
EUR/JPY Current price: 147.97
View Live Chart for the EUR/JPY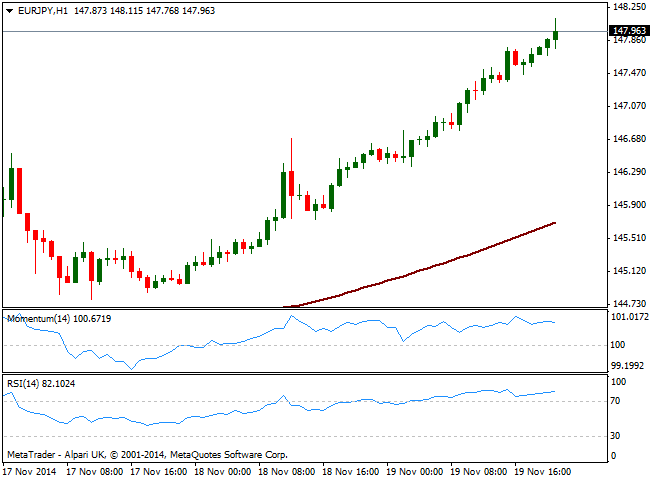
American indexes run higher after the FED, as the Central Bank didn’t offer many clues about an upcoming rate hike, with index surging as chances of a move early 2015 diminished and pressuring down yen pairs with the EUR/JPY up to 148.11, fresh year highs. Short term, the pair is as lately extremely overbought according to technical readings in the 1 hour chart, with RSI aiming higher around 81; in the 4 hours chart indicators stand firm in positive territory, with RSI also in overbought territory, and far from signaling a short term retracement. As it happens usually with yen crosses, once a trend is set, prices tend to move in one way despite whatever oversold/overbought conditions indicators may indicate: further gains are to be expected, with some consolidation in between, and retracements seen as buying opportunities.
Support levels: 147.70 147.24 136.90
Resistance levels: 148.20 148.60 149.00
GBP/USD Current price: 1.5702
View Live Chart for the GBP/USD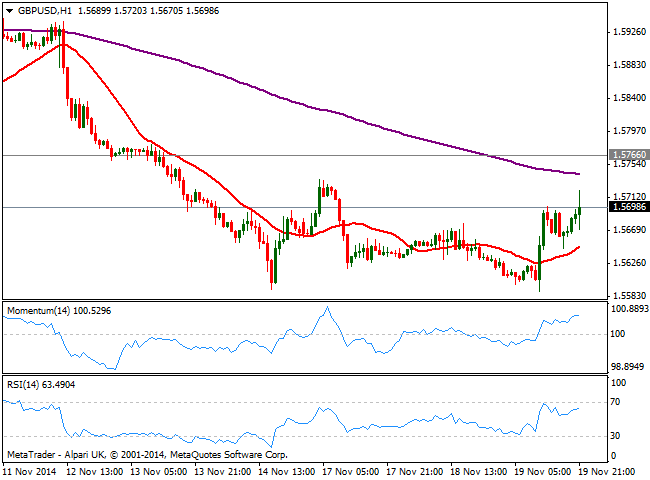
Pound extended its early gains against the greenback, trying tp extend them above the 1.5700 figure after FED’s news. The pair was quite a ride this Wednesday, down to a fresh year low of 1.5582 early European session, pressured ahead of BOE Minutes. These last resulted quite hawkish compared to latest gloomy quarterly inflation report, as two policymakers again voted for rate hikes despite a weaker economic outlook. Technically, the pair seems to be developing a double bottom daily basis around 1.5585, albeit the neckline of the figure stands at 1.5740, November 17th high, which means further gains above it are required to confirm it. Short term, the 1 hour chart shows price above a mild bullish 20 SMA and indicators grinding higher above their midlines, while the 4 hours chart shows indicators losing upward strength but above their midlines, supporting some further advances. The level to watch to the downside is 1.5650, as a price decline below it should deny the possibility of a recovery and favor a decline back towards 1.5600/10 price zone.
Support levels: 1.5650 1.5610 1.5585
Resistance levels: 1.5740 1.5770 1.5815
USD/JPY Current price: 117.82
View Live Chart for the USD/JPY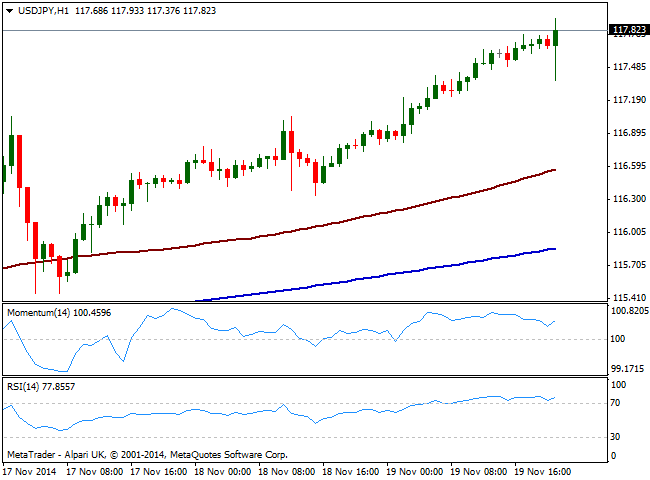
The USD/JPY suffered a short squeeze lower with the news, down to 117.37, but quickly trades at fresh highs for the year, having already flirted with the 118.00 figure. Market reaction shows clearly the strength of buyers around the pair, and the 1 hour chart shows indicators regaining the upside after barely correcting overbought readings, whist price again accelerated way above 100 and 200 SMAs. In the 4 hours chart indicators head higher above their midlines, supporting the shorter term view, and pointing for some further advances with immediate resistance now at 118.20.
Support levels: 117.45 117.05 116.60
Resistance levels: 118.20 118.60 119.00
AUD/USD Current price: 0.8612
View Live Chart of the AUD/USD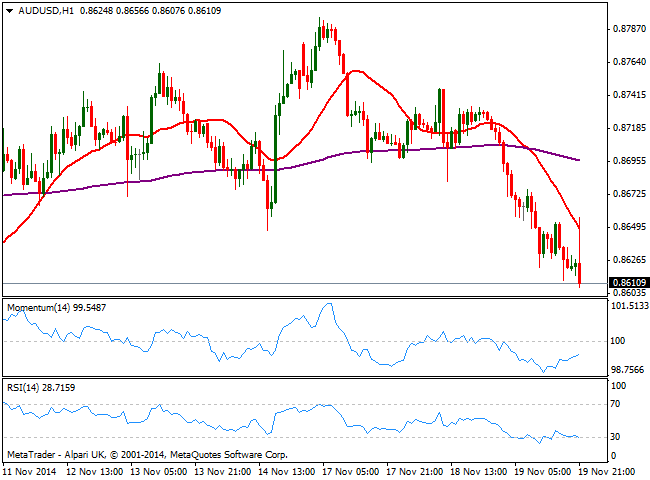
The AUD/USD pair was unable to shrug off the bearish momentum seen since the day started, failing to maintain the short term gains triggered by the news and diving to new daily lows near the 0.8600 figure. The 1 hour chart shows price was rejected by a strongly bearish 20 SMA while indicators remain in bearish territory, gaining bearish strength. In the 4 hours chart RSI accelerates south approaching 30, momentum stands below 100 and 20 SMA slowly turns south now in the 0.8710 price zone. The downside is now exposed towards 0.8550 price zone, with a break below probably triggering the latest bulls’ stops and favoring a stronger downward acceleration for the upcoming sessions.
Support levels: 0.8580 0.8550 0.8505
Resistance levels: 0.8645 0.8690 0.8740
Recommended Content
Editors’ Picks
AUD/USD stands firm above 0.6500 with markets bracing for Aussie PPI, US inflation

The Aussie Dollar begins Friday’s Asian session on the right foot against the Greenback after posting gains of 0.33% on Thursday. The AUD/USD advance was sponsored by a United States report showing the economy is growing below estimates while inflation picked up. The pair traded at 0.6518.
EUR/USD mired near 1.0730 after choppy Thursday market session

EUR/USD whipsawed somewhat on Thursday, and the pair is heading into Friday's early session near 1.0730 after a back-and-forth session and complicated US data that vexed rate cut hopes.
Gold soars as US economic woes and inflation fears grip investors

Gold prices advanced modestly during Thursday’s North American session, gaining more than 0.5% following the release of crucial economic data from the United States. GDP figures for the first quarter of 2024 missed estimates, increasing speculation that the US Fed could lower borrowing costs.
Bitcoin price continues to get rejected from $65K resistance as SEC delays decision on spot BTC ETF options

Bitcoin (BTC) price has markets in disarray, provoking a broader market crash as it slumped to the $62,000 range on Thursday. Meanwhile, reverberations from spot BTC exchange-traded funds (ETFs) continue to influence the market.
US economy: Slower growth with stronger inflation

The dollar strengthened, and stocks fell after statistical data from the US. The focus was on the preliminary estimate of GDP for the first quarter. Annualised quarterly growth came in at just 1.6%, down from the 2.5% and 3.4% previously forecast.