EUR/USD Current price: 1.2522
View Live Chart for the EUR/USD
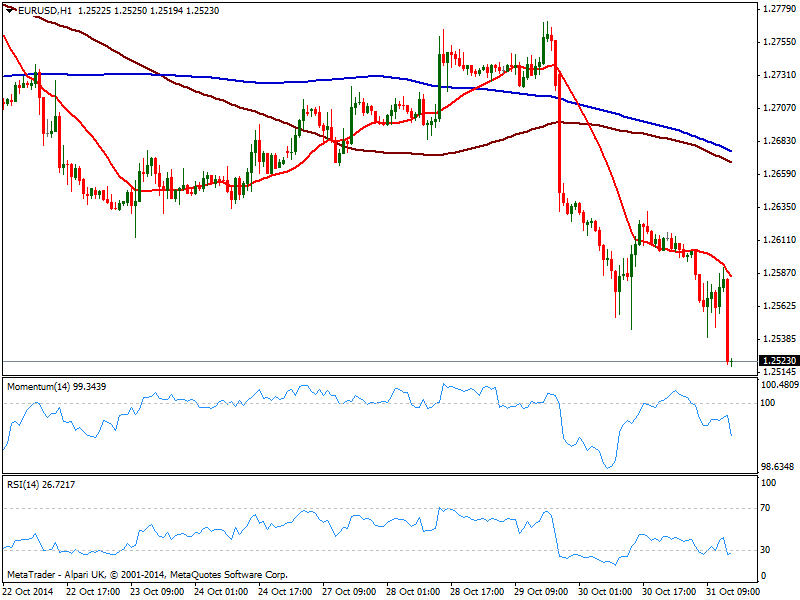
The EUR/USD approaches quickly to its year low of 1.2501 ahead of US opening, posting a fresh daily low of 1.2521 at the time of writing. The movement came despite US consumer spending fell in September for the first time in eight months, down to -0.2% alongside with a small pullback also in incomes: markets are nothing about data today, but about Central Banks imbalances: as the FED gave a farewell to QE, the Bank of Japan announced an increase its one, while the ECB is expected o launch its ABC program next week.
Technically, the 1 hour chart shows price having found resistance at a bearish 20 SMA while indicators turned south deep in the red. In the 4 hours chart technical readings maintain a strong bearish momentum despite in oversold territory, with a break below 1.2500 probably triggering stop and fueling the slide down to 1.2440 price zone.
Support levels: 1.2500 1.2440 1.2370
Resistance levels: 1.2560 1.2620 1.2660
GBP/USD Current price: 1.5962
View Live Chart for the GBP/USD
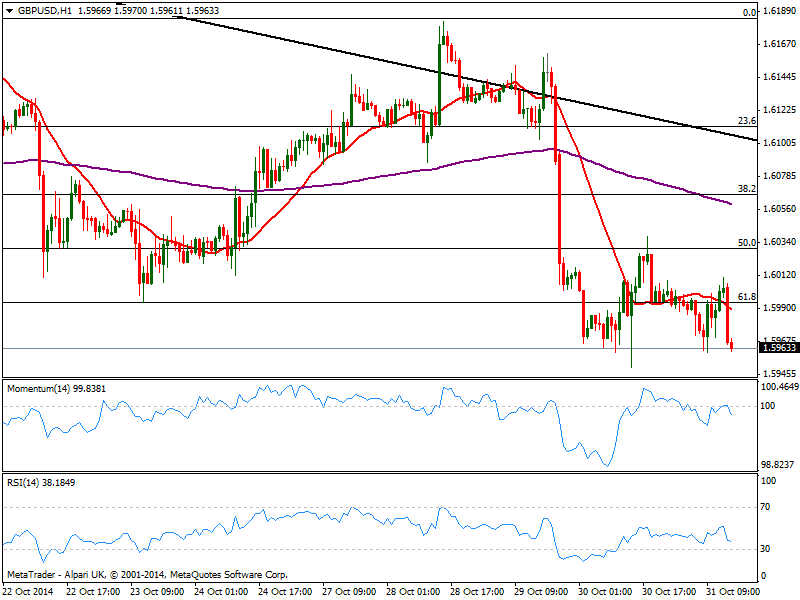
The GBP/USD also resumed its slide after flirting with the 50.0% retracement of its latest bullish run late Thursday, accelerating south as US players come to join the party. The 1 hour chart shows a strong bearish momentum as per current candle downward acceleration below its 20 SMA, while indicators turned strongly south into negative territory. In the 4 hours chart technical readings also present a bearish bias, suggesting further declines below the weekly low of 1.5950 should accelerate the selloff towards the month low of 1.5874
Support levels: 1.5950 1.5910 1.5875
Resistance levels: 1.6000 1.6035 1.6060
USD/JPY Current price: 111.91
View Live Chart for the USD/JPY
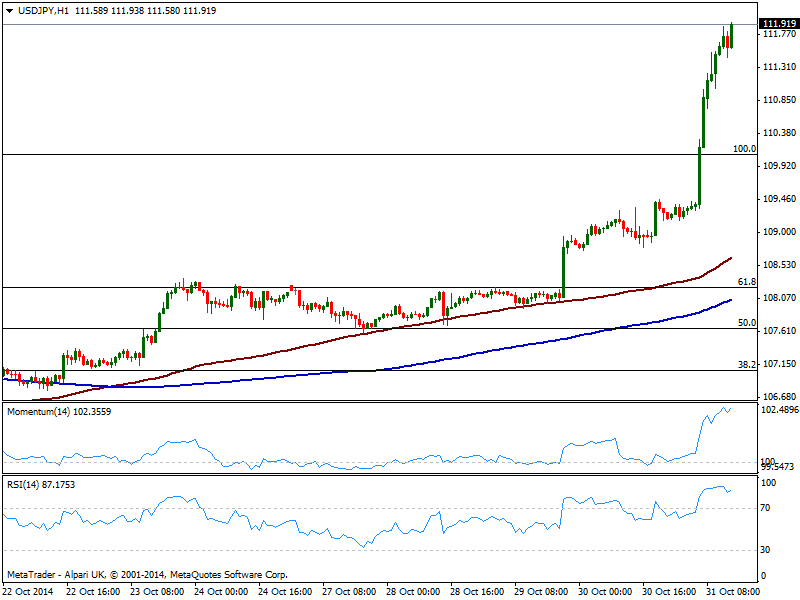
Unstoppable USD/JPY approaches 112.00, having added over 260 pips after BOJ’s decision to increase its monetary easing program, from previous ¥60-70-trillion to a total of¥80-trillion. Technically, the 1 and 4 hours charts shows extreme overbought reading coming from technical indicators, yet price posts higher highs without looking back, far from suggesting exhaustion or a trend change. Trading at levels not seen since 2008, the pair is not known for its ability of making pullbacks: once a trend starts, it doesn’t look back: some steady consolidation above 112.00 should favor further advances, although extreme cautious is recommended at this point.
Support levels: 111.55 111.20 110.80
Resistance levels: 112.00 112.45 112.90
AUD/USD Current price: 0.8785
View Live Chart of the AUD/USD
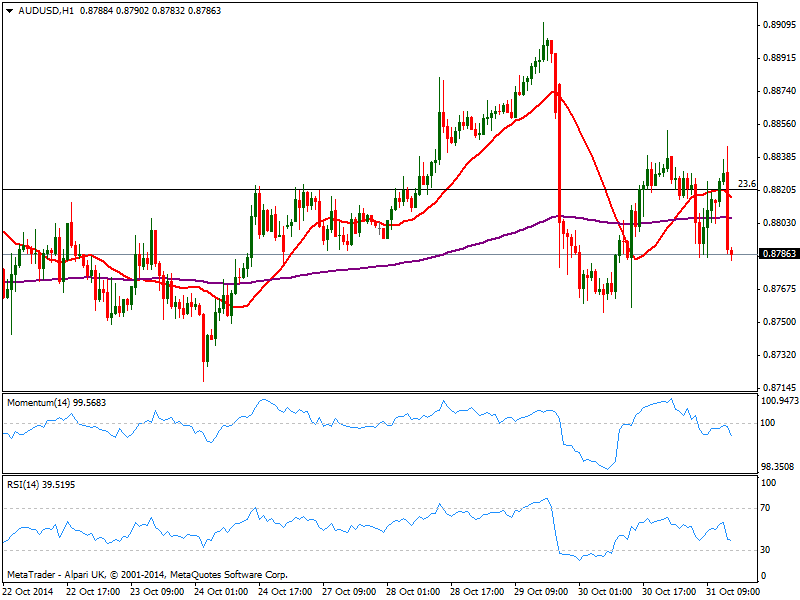
Despite the strong run in stocks, Aussie also capitulates against the greenback as gold trades at a fresh 4 year low. The 1 hour chart shows another failure attempt to break above 0.8820 as price approaches 0.8870 immediate support, with indicators heading lower below their midlines and 20 SMA capping the upside around mentioned Fibonacci resistance. In the 4 hours chart 20 SMA stands flat also around 0.8820, while indicators turned lower below their midlines, supporting further falls.
Support levels: 0.8770 0.8730 0.8690
Resistance levels: 0.8820 0.8850 0.8890
Recommended Content
Editors’ Picks
EUR/USD fluctuates near 1.0700 after US data

EUR/USD stays in a consolidation phase at around 1.0700 in the American session on Wednesday. The data from the US showed a strong increase in Durable Goods Orders, supporting the USD and making it difficult for the pair to gain traction.
USD/JPY refreshes 34-year high, attacks 155.00 as intervention risks loom

USD/JPY is renewing a multi-decade high, closing in on 155.00. Traders turn cautious on heightened risks of Japan's FX intervention. Broad US Dollar rebound aids the upside in the major. US Durable Goods data are next on tap.
Gold keeps consolidating ahead of US first-tier figures

Gold finds it difficult to stage a rebound midweek following Monday's sharp decline but manages to hold above $2,300. The benchmark 10-year US Treasury bond yield stays in the green above 4.6% after US data, not allowing the pair to turn north.
Worldcoin looks set for comeback despite Nvidia’s 22% crash Premium

Worldcoin price is in a better position than last week's and shows signs of a potential comeback. This development occurs amid the sharp decline in the valuation of the popular GPU manufacturer Nvidia.
Three fundamentals for the week: US GDP, BoJ and the Fed's favorite inflation gauge stand out Premium

While it is hard to predict when geopolitical news erupts, the level of tension is lower – allowing for key data to have its say. This week's US figures are set to shape the Federal Reserve's decision next week – and the Bank of Japan may struggle to halt the Yen's deterioration.