EUR/USD Current price: 1.2737
View Live Chart for the EUR/USD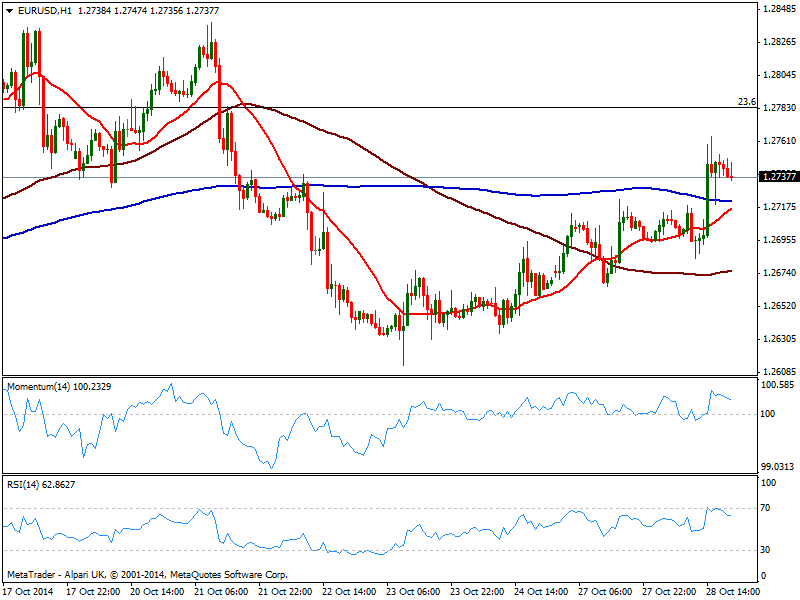
Dollar ends lower across the board, particularly hit against commodity currencies since early European session, with both CAD and AUD surging to fresh multi week highs. As for European ones, the early session was extremely quiet ahead of US data, which ended up being quite mixed: first strong reading saw Durable Goods Orders missing expectations by far printing a whopping -1.3% for September, and triggering a dollar sell off across the board. 1 hour later US consumer confidence soared to a seven year high of 94.5, yet market players decided it was enough: there was almost no reaction across the forex board to this latest news, except a mild advance in USD/JPY. All eyes turned now to the FED monetary policy decision upcoming Wednesday, expected to trim the last $15B of QE and keep the wording unchanged.
As for the EUR/USD, the 1 hour chart shows indicators turning lower towards their midlines, with price holding above its moving averages: 20 SMA heads higher with a nice bullish slope, currently around 1.2710 acting as dynamic short term support. In the 4 hours chart indicators has lost the upward strength but remain in positive territory and far from suggesting a retracement. A critical resistance stands now in the 1.2780/90 price zone where the pair stalled several times over this October, and will probably keep the upside limited until the news.
Support levels: 1.2710 1.2670 1.2630
Resistance levels: 1.2790 1.2840 1.2885
EUR/JPY Current price: 137.62
View Live Chart for the EUR/JPY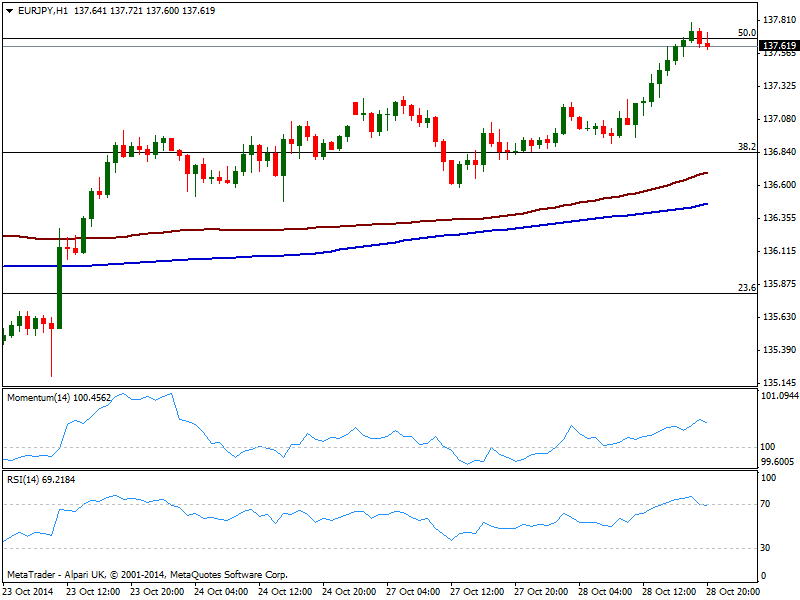
Yen extended its early week decline on the back of another good day among stocks, with indexes edging higher both in Europe and the US. Euro advanced favored an EUR/JPY jump up to current levels, stalling around a critical resistance: 100 DMA stands a couple pips above current price, alongside with the 50% retracement of the 141.21/134.13 slide. Having seen practically no retracements after reaching 137.79, risk has turned towards further gains. Technically, the 1 hour chart shows indicators turning flat in overbought territory, while 100 and 200 SMAs finally start to move, gaining some bullish slope well below current price. In the 4 hours chart the bias is also higher, with some further advances beyond 137.90 now required to confirm more intraday gains.
Support levels: 137.40 137.00 136.60
Resistance levels: 137.90 138.40 138.85
GBP/USD Current price: 1.6129
View Live Chart for the GBP/USD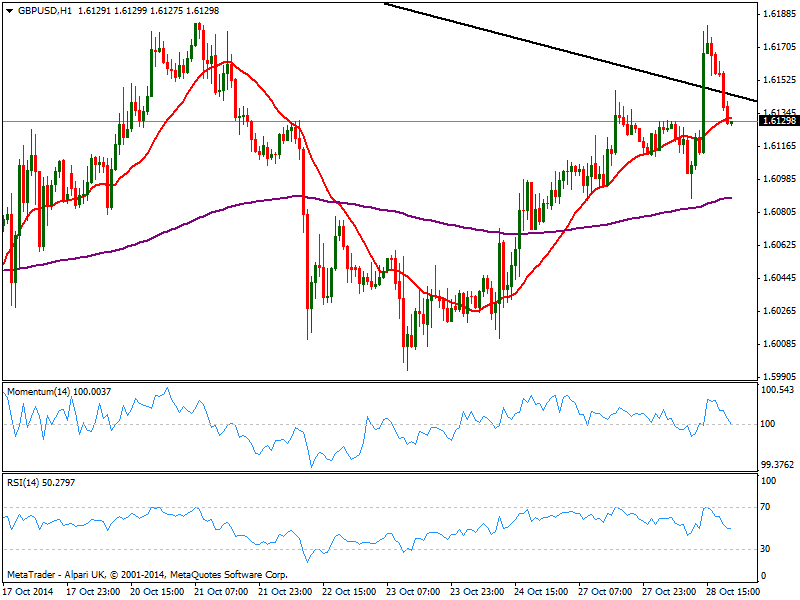
Having posted a daily high of 1.6182, the GBP/USD finally pulled back below the daily ascendant trend line coming form 1.7190, leaving a bitter taste on bull’s mouth. The slow but steady slide over American hours, sees the pair entering Asian ones with a bearish short term tone, as per current candle opening below its 20 SMA and indicators about to cross their midlines to the downside with a strong bearish slope. In the 4 hours chart indicators also turned lower but remain well above their midlines, while 20 SMA now offers immediate intraday support at 1.6090. Furthermore in this last time frame, 200 EMA capped the upside around mentioned daily high quite significant in the longer run, as further declines will point for a return of the bearish trend.
Support levels: 1.6090 1.6050 1.6010
Resistance levels: 1.6145 1.6185 1.6220
USD/JPY Current price: 108.80
View Live Chart for the USD/JPY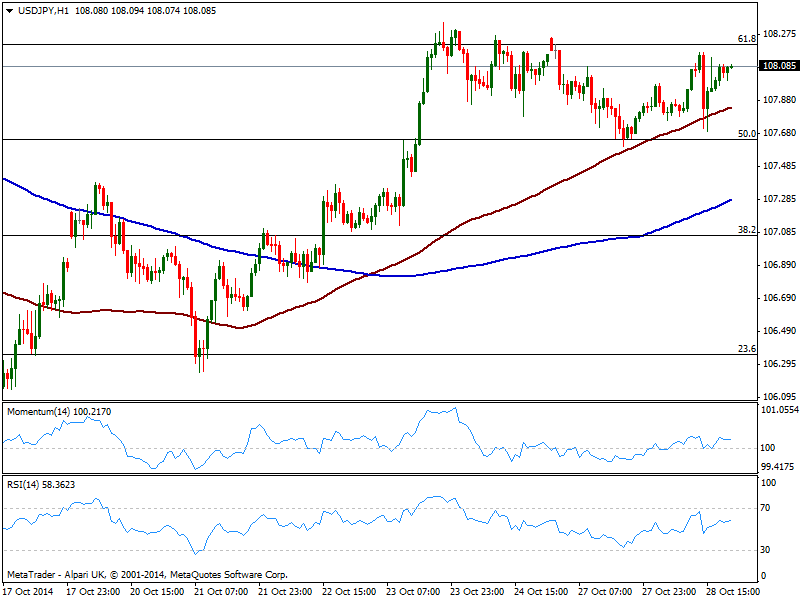
The USD/JPY has made little progress this Tuesday, confined to the range set by Fibonacci levels, in between 107.60 and 108.20: those represent the 50% and the 61.8% retracements of the latest bearish run from 110.08/105.19. The 1 hour chart maintains a mild positive tone, with indicators flat above their midlines, but 100 SMA maintaining a strong upward tone and still advancing well above 200 one. In the 4 hours chart, technical readings are quite neutral, which means a clear break of mentioned extremes is required to see the pair setting a more directional bias.
Support levels: 107.55 107.10 106.70
Resistance levels: 108.20 108.50 108.90
AUD/USD Current price: 0.8855
View Live Chart of the AUD/USD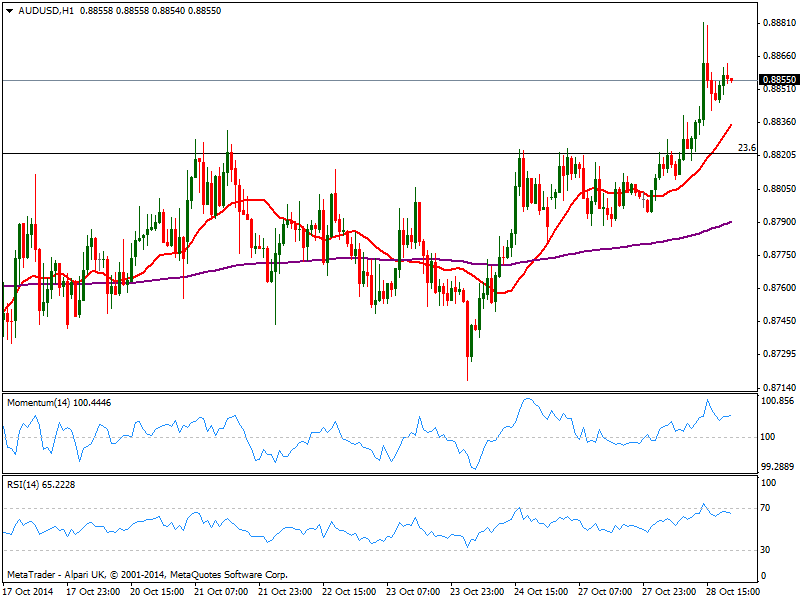
Aussie finally woke up, reaching 0.8881 against the greenback, and holding now well above the 0.8820 support as a new day starts. The latest slide may have to do partially with gold late slump, as the metal gave up most of its intraday gains in the latest hours. Nevertheless, the pair maintains a bullish tone as per the breakout of its latest range. Technically the 1 hour chart shows a positive tone with indicators now flat above their midlines and a strong bullish 20 SMA well below current price. In the 4 hours chart the picture is quite similar, with price above a flat 20 SMA and indicators now lacking strength in positive territory.
Support levels: 0.8820 0.8770 0.8730
Resistance levels: 0.8890 0.8930 0.8970
Recommended Content
Editors’ Picks
AUD/USD pressures as Fed officials hold firm on rate policy

The Australian Dollar is on the defensive against the US Dollar, as Friday’s Asian session commences. On Thursday, the antipodean clocked losses of 0.21% against its counterpart, driven by Fed officials emphasizing they’re in no rush to ease policy. The AUD/USD trades around 0.6419.
EUR/USD extends its downside below 1.0650 on hawkish Fed remarks

The EUR/USD extends its downside around 1.0640 after retreating from weekly peaks of 1.0690 on Friday during the early Asian session. The hawkish comments from Federal Reserve officials provide some support to the US Dollar.
Gold price edges higher on risk-off mood hawkish Fed signals

Gold prices advanced late in the North American session on Thursday, underpinned by heightened geopolitical risks involving Iran and Israel. Federal Reserve officials delivered hawkish messages, triggering a jump in US Treasury yields, which boosted the Greenback.
Runes likely to have massive support after BRC-20 and Ordinals frenzy

With all eyes peeled on the halving, Bitcoin is the center of attention in the market. The pioneer cryptocurrency has had three narratives this year already, starting with the spot BTC exchange-traded funds, the recent all-time high of $73,777, and now the halving.
Billowing clouds of apprehension

Thursday marked the fifth consecutive session of decline for US stocks as optimism regarding multiple interest rate cuts by the Federal Reserve waned. The downturn in sentiment can be attributed to robust economic data releases, prompting traders to adjust their expectations for multiple rate cuts this year.