EUR/USD Current price: 1.2709
View Live Chart for the EUR/USD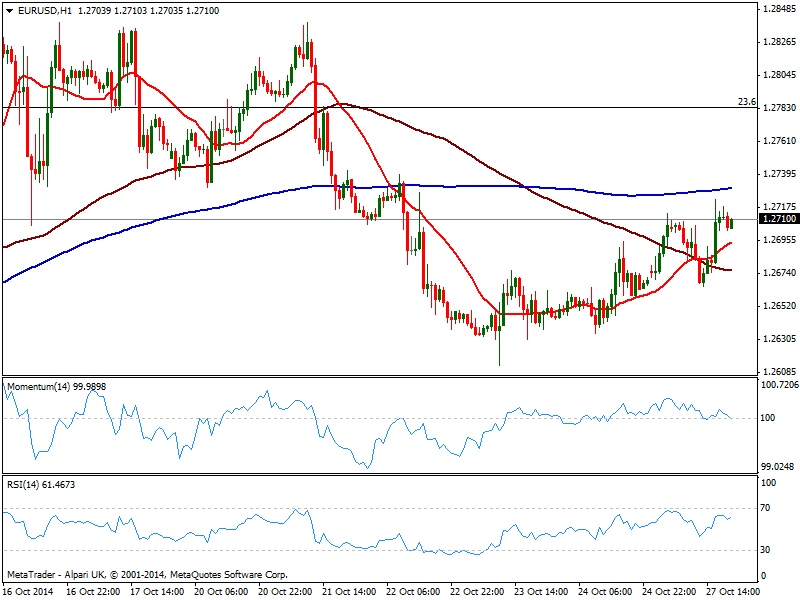
The EUR/USD managed to establish itself above the 1.2700 mark despite unable to show some follow through, in a quite choppy Monday. The early week relief provided by ECB stress test suffered a setback after the release of worse than expected German IFO survey, sending the pair down to a daily low of 1.2665. Early American session, US data also disappointed, with local PMI and Pending home sales below expected and forecasted. The dollar shed ground across the board, reaching some critical levels against most rivals where it stands by US close.
Despite a weak greenback, majors had remained within familiar ranges, as investors are wary to move them to far away in light of upcoming FED meeting next Wednesday. As for the technical short term picture for the EUR/USD, the 1 hour chart shows 20 SMA gaining bullish slope below current price whilst indicators maintain a neutral stance. In the 4 hours chart indicators stand in positive territory albeit showing no directional strength at the time being. A break above 1.2720 should lead to a quick test of 1.2750 price zone, while once above this last, the 1.2780/90 strong Fibonacci area comes next.
Support levels: 1.2665 1.2620 1.2580
Resistance levels: 1.2720 1.2750 1.2790
EUR/JPY Current price: 136.86
View Live Chart for the EUR/JPY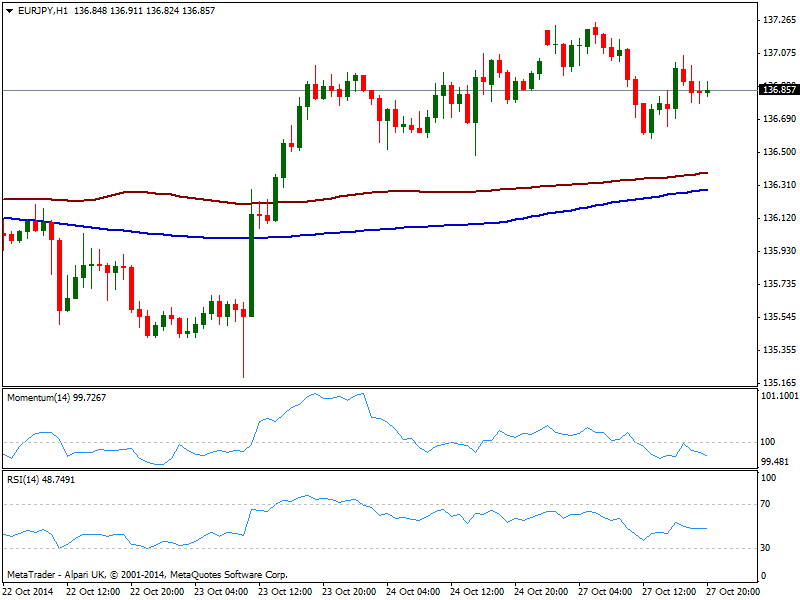
Yen recovered some ground against its majors rivals this Monday after its weak start, as stocks faltered around critical supports tested early Sunday opening: having traded in the red for most of the day, American indexes managed to regain half the ground lost yet remain vulnerable to a bearish run, now that the easy money may be gone for good. Technically the EUR/JPY trades back below the 137.00 mark, with a mild bearish tone coming from the 1 hour indicators, heading lower below their midlines, and with 100 and 200 SMAs in the mentioned chart flat around 136.20/30. In the 4 hours chart price behavior is quite uncertain on what’s next as candles show little bodies and long shadows either side of the board, while indicators turn lower above their midlines. The daily low around 136.60 comes as immediate support while some follow through beyond 137.40 is required to erase the current negative short term tone.
Support levels: 136.60 136.10 135.70
Resistance levels: 137.40137.90 138.40
GBP/USD Current price: 1.6128
View Live Chart for the GBP/USD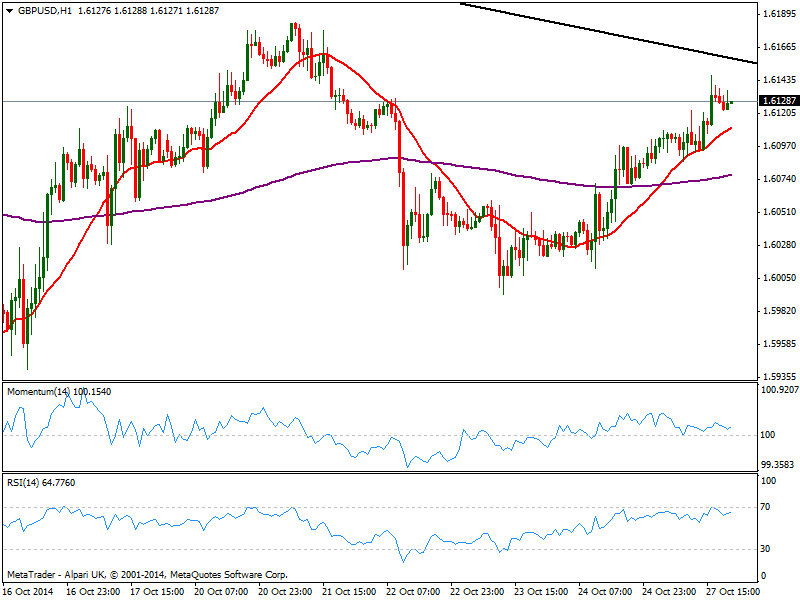
The GBP/USD has managed to add some ground, advancing to a daily high of 1.6146 before stalling now holding a few pips above the 1.6125 static level. Despite lacking momentum, the 1 hour chart shows indicators steady above their midlines, aiming slightly higher, and 20 SMA heading north below current price, offering intraday support now around 1.6105. In the 4 hours chart, technical readings present a strong upward momentum with price nearing a critical resistance, the long term descendant trend line coming from 1.7190 around 1.6160. Large stops are suspected above and if triggered, the bullish run my accelerate quickly up to 1.6200 area; back below 1.6100 on the other hand, chances are of a pullback down to 1.6030 before buying interest surges.
Support levels: 1.6100 1.6070 1.6030
Resistance levels: 1.6160 1.6200 1.6250
USD/JPY Current price: 107.71
View Live Chart for the USD/JPY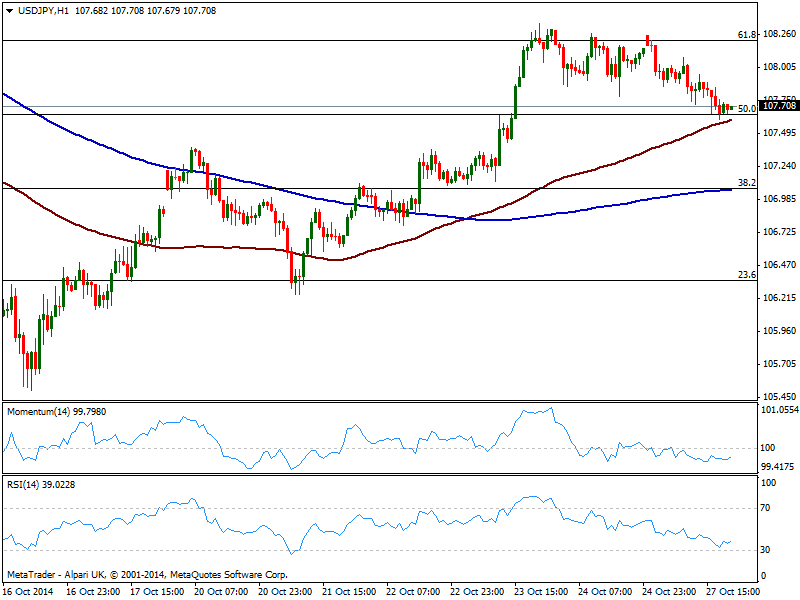
The USD/JPY declined down to the 50% retracement of the 110.08/105.20 at 107.65 where it stands, having felt with stocks but staying at the lows despite the recovery in indexes. The 1 hour chart shows 100 SMA a few pips below mentioned Fibonacci level with a strong upward slope, while indicators show no clear directional strength right below their midlines. In the 4 hours chart however, indicators present a strong bearish tone, with momentum crossing 100 to the downside with a nice angle that suggests further slides ahead, to be confirmed on a downward acceleration through 107.55.
Support levels: 107.55 107.10 106.70
Resistance levels: 108.20 108.50 108.90
AUD/USD Current price: 0.8804
View Live Chart of the AUD/USD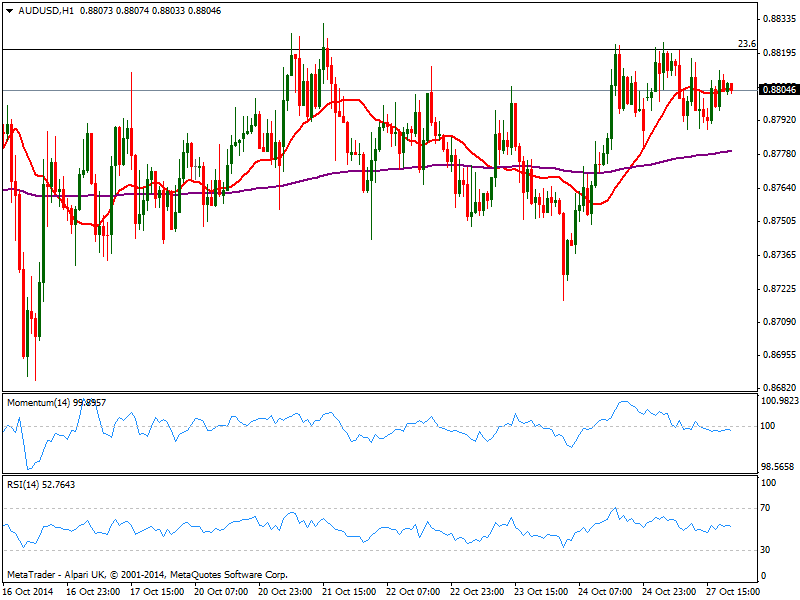
Nothing new to report about AUD/USD, sill confined to the 0.8770/0.8820 range, having been again rejected from the high a couple times during Asian hours. The pair however, comes closer to the top of the range as time goes by, yet the technical picture, at least in the short term, remains far from suggesting a bullish break out: indicators remain flat in neutral territory. In the 4 hours chart there had been no changes either, with indicators horizontal right above their midlines and 20 SMA horizontal a few pips below current price.
Support levels: 0.8770 0.8730 0.8690
Resistance levels: 0.8820 0.8860 0.8900
Recommended Content
Editors’ Picks
AUD/USD failed just ahead of the 200-day SMA

Finally, AUD/USD managed to break above the 0.6500 barrier on Wednesday, extending the weekly recovery, although its advance faltered just ahead of the 0.6530 region, where the key 200-day SMA sits.
EUR/USD met some decent resistance above 1.0700

EUR/USD remained unable to gather extra upside traction and surpass the 1.0700 hurdle in a convincing fashion on Wednesday, instead giving away part of the weekly gains against the backdrop of a decent bounce in the Dollar.
Gold keeps consolidating ahead of US first-tier figures

Gold finds it difficult to stage a rebound midweek following Monday's sharp decline but manages to hold above $2,300. The benchmark 10-year US Treasury bond yield stays in the green above 4.6% after US data, not allowing the pair to turn north.
Bitcoin price could be primed for correction as bearish activity grows near $66K area

Bitcoin (BTC) price managed to maintain a northbound trajectory after the April 20 halving, despite bold assertions by analysts that the event would be a “sell the news” situation. However, after four days of strength, the tables could be turning as a dark cloud now hovers above BTC price.
Bank of Japan's predicament: The BOJ is trapped

In this special edition of TradeGATEHub Live Trading, we're joined by guest speaker Tavi @TaviCosta, who shares his insights on the Bank of Japan's current predicament, stating, 'The BOJ is Trapped.'