EUR/USD Current price: 1.2805
View Live Chart for the EUR/USD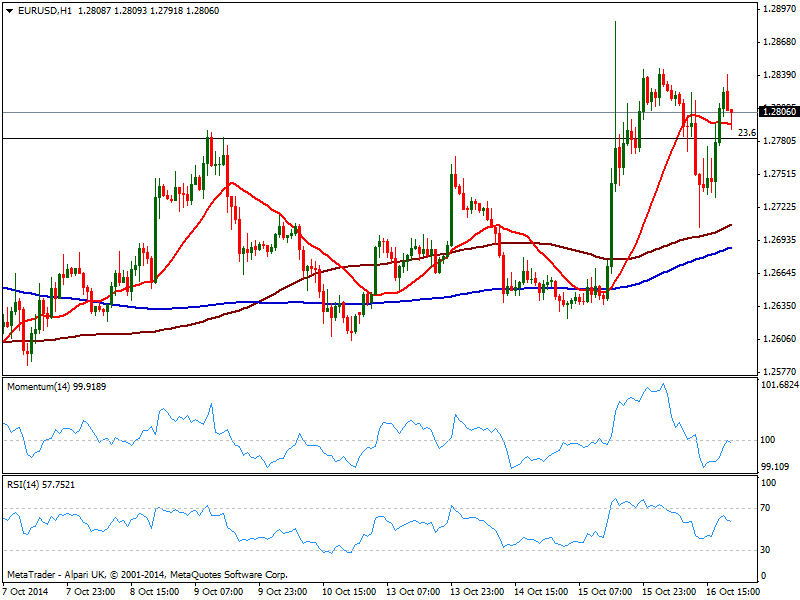
Roller-coaster trading extended into Thursday, with price action clearly reflecting latest developments got to investors’ nerves. European stocks opened with a positive tone, but sunk ahead of US opening with US indexes also diving early American session. Dollar attempted a came back after the release of positive US data, regarding employment and manufacturing, but after over a week of steady declines, greed overlapped fear: stocks become cheap and charming, and US indexes bounced strongly up to close pretty much unchanged from Wednesday close.
In the EUR/USD, a deep to 1.2700 was also seen as a buying opportunity, with the pair surging back above the 1.2800 figure where it stands early Asian session. The 1 hour chart shows price struggling above a flat 20 SMA and indicators losing upward potential around their midlines, yet the 4 hours chart maintains a strong upward momentum, suggesting the rally may finally extend through 1.2845 immediate resistance.
Support levels: 1.2790 1.2740 1.2700
Resistance levels: 1.2845 1.2890 1.2930
EUR/JPY Current price: 135.86
View Live Chart for the EUR/JPY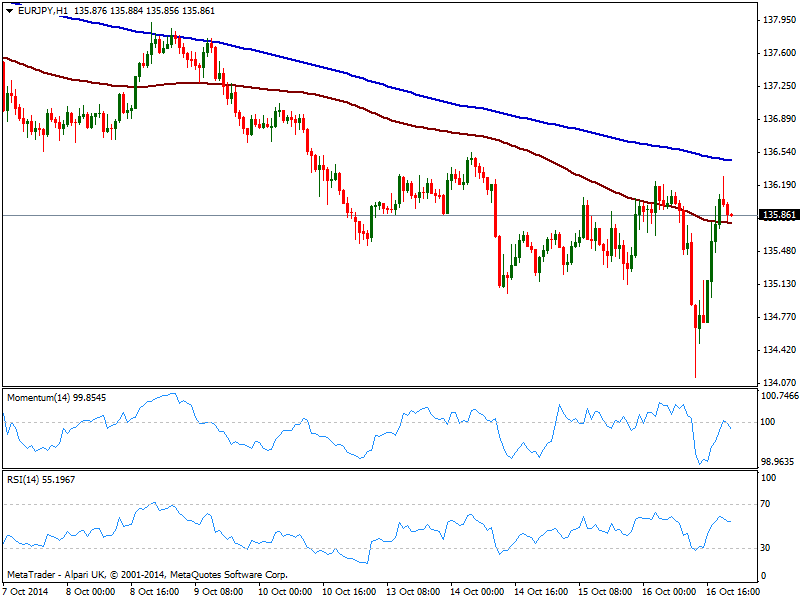
The EUR/JPY recovered strongly from a fresh year low of 134.13 but remains unable to firmly establish above the 136.00 mark. Trading a few pips below the daily opening, the daily candle shows a lower low and a higher high, and considering how attached yen has been to stocks lately, if the recovery in indexes extends into Asia, chances are to the upside. Short term, the 1 hour chart shows price above 100 SMA but indicators retracing from their midlines, not yet confirming further advances. In the 4 hours chart technical readings present a clear upward momentum, to be confirmed with some steady advance beyond 136.00/20 price zone.
Support levels: 135.50 134.90 134.50
Resistance levels: 135.90 136.20 136.70
GBP/USD Current price: 1.6070
View Live Chart for the GBP/USD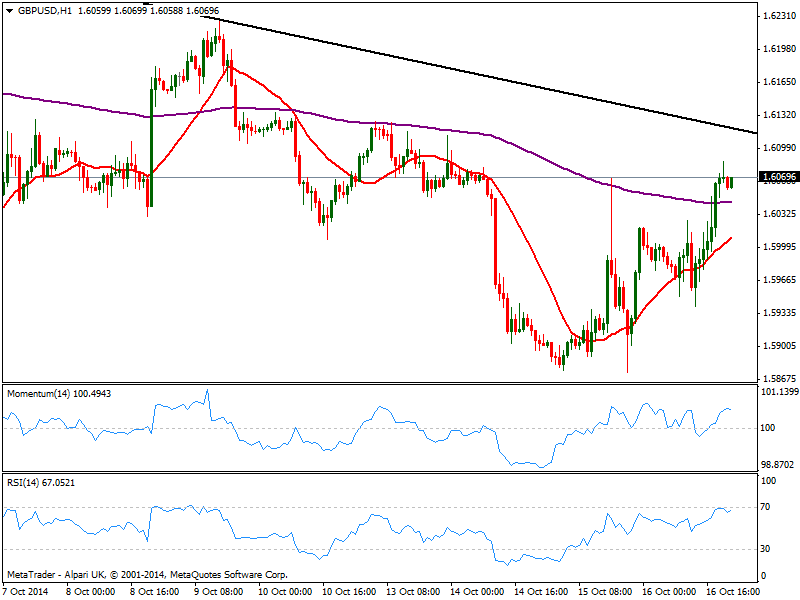
The GBP/USD pressures the 1.6100 figure late US afternoon, with the 1 hour chart showing indicators easing near overbought territory, but 20 SMA maintaining a strong upward slope, and considering price behavior, seems further advances will follow. In the 4 hours chart technical readings present a strong upward tone also, but 20 SMA however maintains a mild bearish slope below current price, not yet aiming to turn higher. Critical level stands now at 1.6110/20 price zone, a daily descendant trend line coming from 1.6253: a break above it should confirm the upward continuation, while 1.6060 now is the short term line in the sand towards the downside.
Support levels: 1.606 1.6020 1.5970
Resistance levels: 1.6115 1.6150 1.6190
USD/JPY Current price: 106.22
View Live Chart for the USD/JPY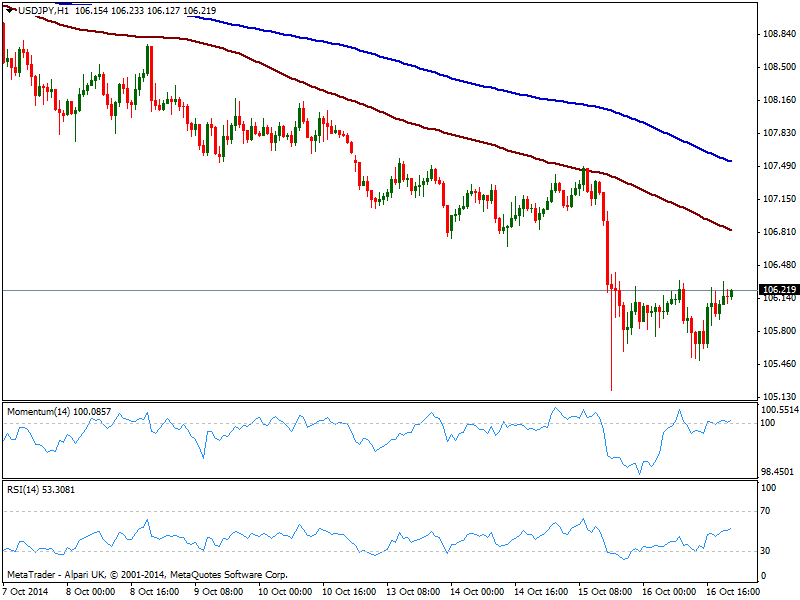
The USD/JPY presents limited intraday gains this Thursday, trading near 106.30 resistance and having post a higher low daily basis, of 105.50. The 1 hour chart shows indicators mostly neutral and with a quite limited upward slope, while 100 and 200 SMAs maintain a strong bearish slope well above current price, with the shorter offering dynamic resistance now around 106.80. In the 4 hours chart indicators aim higher from overbought territory while moving averages stand way above current price. An advance above 106.30 should signal some short term gains towards 106.70/80 price zone, but it will take the pair to regain this last to confirm a firmer upward pace.
Support levels: 105.90 105.50 105.10
Resistance levels: 106.30 106.70 107.10
AUD/USD Current price: 0.8764
View Live Chart of the AUD/USD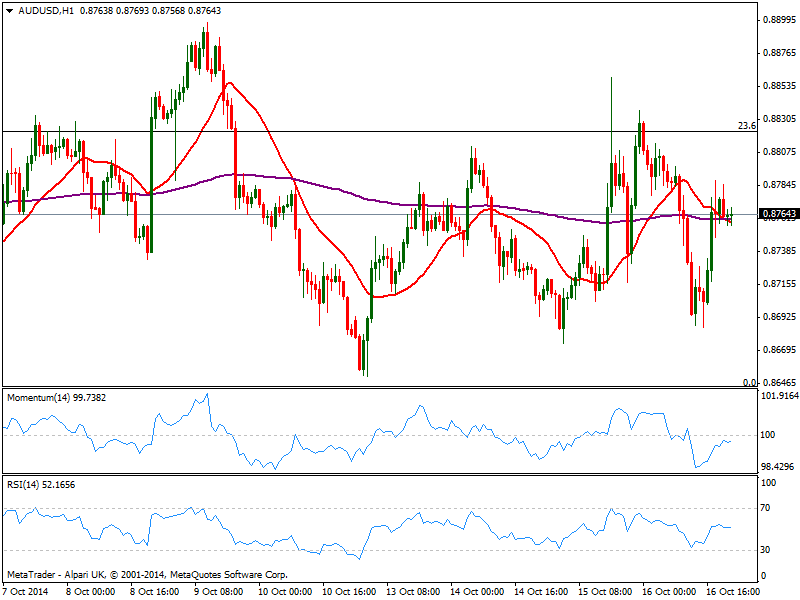
The AUD/USD remains within range daily basis, finding short term sellers in the 0.8800 level. The 1 hour chart shows a mild bearish tone as per price pressuring a bearish to20 SMA from above, and indicators turning lower below their midlines. In the 4 hours chart technical indicators aim higher around their midlines, while price continues to move back and forth around a flat 20 SMA. As commented on previous updates, the pair will remain neutral until either 0.8820 or 0.8640 finally gives up.
Support levels: 0.8730 0.8690 0.8640
Resistance levels: 0.8770 0.8820 0.8860
Recommended Content
Editors’ Picks
EUR/USD retreats below 1.0700 after US GDP data

EUR/USD came under modest bearish pressure and retreated below 1.0700. Although the US data showed that the economy grew at a softer pace than expected in Q1, strong inflation-related details provided a boost to the USD.
GBP/USD declines below 1.2500 as USD rebounds

GBP/USD declined below 1.2500 and erased the majority of its daily gains with the immediate reaction to the US GDP report. The US economy expanded at a softer pace than expected in Q1 but the price deflator jumped to 3.4% from 1.8%.
Gold drops below $2,320 as US yields shoot higher

Gold lost its traction and turned negative on the day below $2,320 in the American session on Thursday. The benchmark 10-year US Treasury bond yield is up more than 1% on the day above 4.7% after US GDP report, weighing on XAU/USD.
XRP extends its decline, crypto experts comment on Ripple stablecoin and benefits for XRP Ledger

Ripple extends decline to $0.52 on Thursday, wipes out weekly gains. Crypto expert asks Ripple CTO how the stablecoin will benefit the XRP Ledger and native token XRP.
After the US close, it’s the Tokyo CPI

After the US close, it’s the Tokyo CPI, a reliable indicator of the national number and then the BoJ policy announcement. Tokyo CPI ex food and energy in Japan was a rise to 2.90% in March from 2.50%.