EUR/USD Current price: 1.2360
View Live Chart for the EUR/USD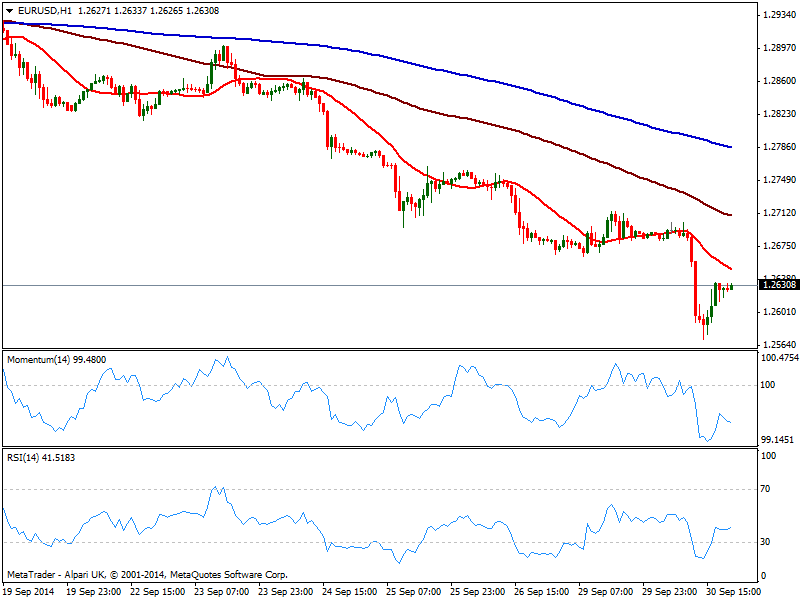
The Euro took another dip this Tuesday, with the EUR/USD down to 1.2570 fresh 2 year low, helped by local inflation readings, pointing out deflationary pressure are here to stay. EZ CPI fell to a 5 year lows in its core reading, albeit the selling in the pair began even before the release. Weaker than expected US data, with Chicago PMI below expected and Consumer confidence down to 86.0 against the 92.5 expected, helped the pair recover above the 1.2600 figure, yet stalled far from former year low of 1.2660, now immediate resistance.
With ECB meeting taking place next Thursday, trading may turn thin ahead of the event, despite Wednesday will bring local PMI readings. Anyway, the short term technical picture is still bearish, with price developing below its 20 SMA and indicators turning south in negative territory after correcting overbought readings. In the 4 hours chart 20 SMA extended its bearish slope, capping the upside now around 1.2880, while indicators barely corrected oversold readings, holding deep in red. Another downward acceleration below mentioned low should see the pair extending its decline towards 1.2510, with sellers now probably surging on approaches to the 1.2660 level.
Support levels: 1.2570 1.2540 1.2510
Resistance levels: 1.2620 1.2660 1.2700
EUR/JPY Current price: 138.52
View Live Chart for the EUR/JPY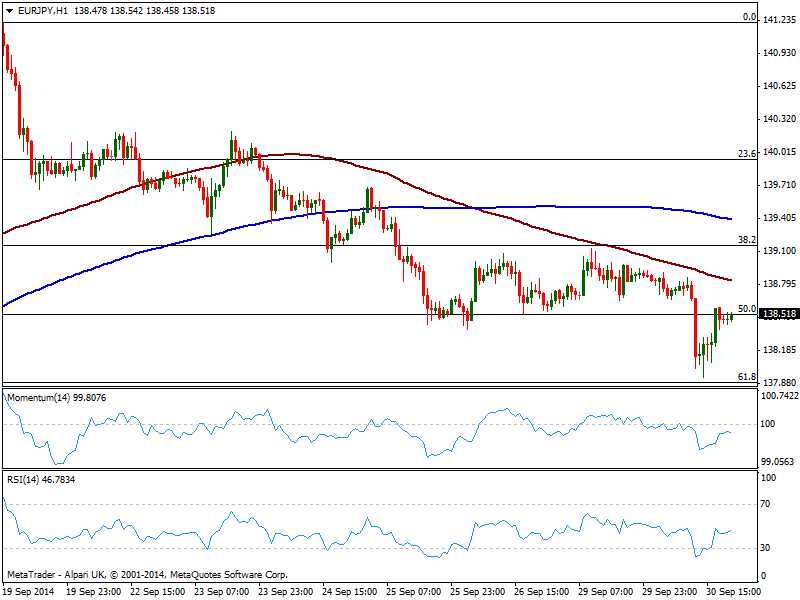
The EUR/JPY fall down to 137.94 on the back of EUR self weakness, managing however to regain most of the ground lost during the US afternoon. US Yields held pretty well despite local mild weak data, supporting yen negative tone. As for the technical picture, the EUR/JPY 1 hour chart shows price struggling around the 50% retracement of its latest daily bullish run, having stalled to the downside a couple pips above the 61.8% retracement of the same rally. The hourly chart shows 100 SMA well below 200 one, and with a strong bearish slope now offering intraday resistance of 138.80, while indicators turn south below their midlines after correcting oversold levels. In the 4 hours chart technical indicators stand directionless in negative territory, giving no much clues of what’s next for the pair. A break below 137.90, is now required to confirm a new run lower, meant to extend towards 135.80 over the upcoming days.
Support levels: 138.40 137.90 137.35
Resistance levels: 139.15 139.60 140.00
GBP/USD Current price: 1.6207
View Live Chart for the GBP/USD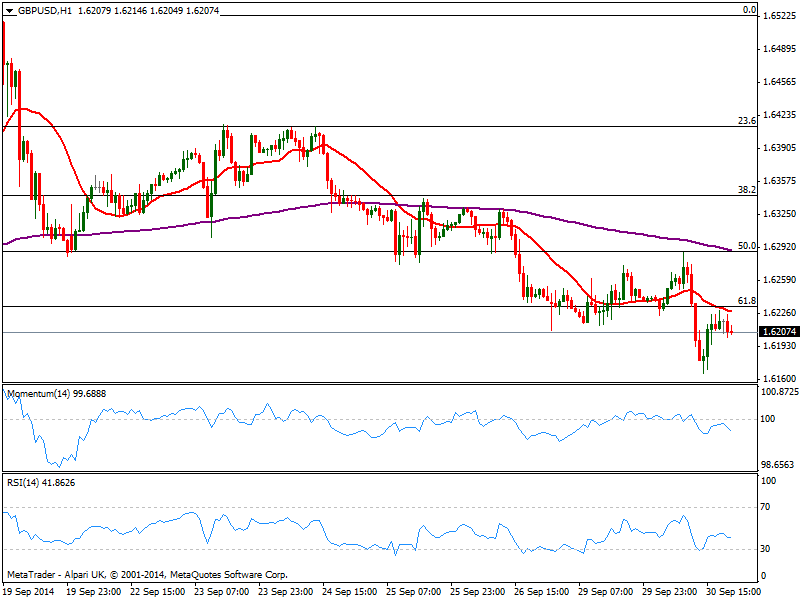
The GBP/USD trades around 1.6200, having ignored GDP positive readings already Europe, sliding along with its European counterpart and reaching 1.6166 from where it bounced. Nevertheless, the pair remained capped below the 61.8% of the latest daily bullish run from 1.6051 to 1.6523 at 1.6235 now immediate resistance. The 1 hour chart shows indicators turning south below their midlines and 20 SMA capping the upside a few pips below mentioned Fibonacci resistance, reinforcing its strength, while the 4 hours chart shows indicators biased lower, supporting the shorter term view. BOE won’t meet until next week, so there’s little to worry about that these days: dollar strength, if continues, may lead the moves with a break below mentioned 1.6160 pointing to a downward extension towards 1.6080/1.6100 price zone.
Support levels: 1.6160 1.6120 1.6085
Resistance levels: 1.6235 1.6260 1.6290
USD/JPY Current price: 109.65
View Live Chart for the USD/JPY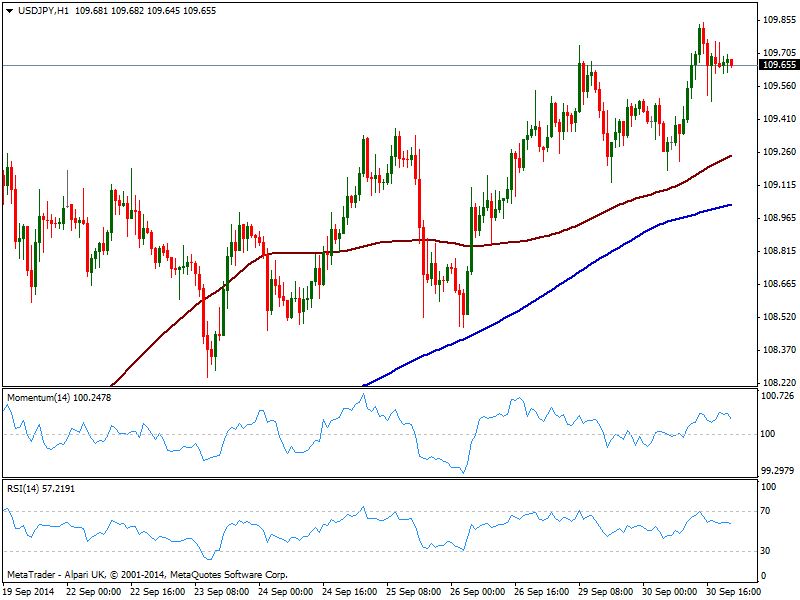
Dollar advanced again against its Japanese rival, with the pair reaching 109.84 before retracing some. Buyers however, surged on small intraday dips towards former high of 109.45, with the pair ending the day near mentioned high. The 1 hour chart shows indicators losing upward potential above their midlines, with moving averages heading higher below current price. As commented on previous updates, the moves can be slowmo, but the direction is up. In the 4 hours chart higher highs support the ongoing bias, despite indicators also turned lower in positive territory: dips down to 108.90 will remain as buying opportunities, at least until Friday’s US NFP readings.
Support levels: 109.45 109.15 108.90
Resistance levels: 109.80 110.20 110.50
AUD/USD Current price: 0.8748
View Live Chart of the AUD/USD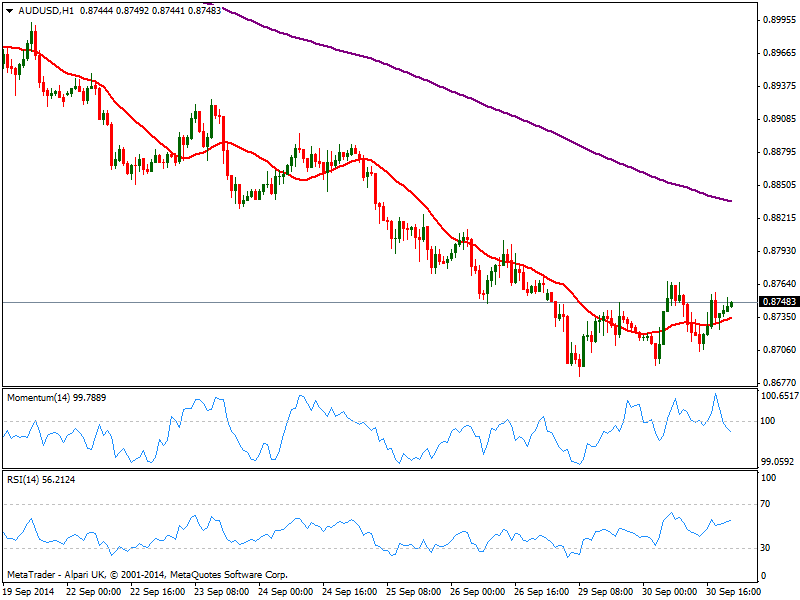
The AUD/USD show little change over US hours, holding within range yet closing the day to the upside, and with a higher high and a higher low, suggesting the pair may be developing a base. Far from confirmed however, there’s a long way up before calling for a bottom, at least a recovery above 0.8920. Short term, the hourly chart shows price above a flat 20 SMA and indicators diverging with each other in neutral territory; the 4 hours chart shows price struggling with a bearish 20 SMA at current levels and momentum turning south below 100, with the daily high of 0.8766 as immediate resistance to overcome to see the pair extending its recovery, at least intraday.
Support levels: 0.8710 0.8680 0.8635
Resistance levels: 0.8765 0.8800 0.8840
Recommended Content
Editors’ Picks
AUD/USD stands firm above 0.6500 with markets bracing for Aussie PPI, US inflation

The Aussie Dollar begins Friday’s Asian session on the right foot against the Greenback after posting gains of 0.33% on Thursday. The AUD/USD advance was sponsored by a United States report showing the economy is growing below estimates while inflation picked up. The pair traded at 0.6518.
EUR/USD mired near 1.0730 after choppy Thursday market session

EUR/USD whipsawed somewhat on Thursday, and the pair is heading into Friday's early session near 1.0730 after a back-and-forth session and complicated US data that vexed rate cut hopes.
Gold soars as US economic woes and inflation fears grip investors

Gold prices advanced modestly during Thursday’s North American session, gaining more than 0.5% following the release of crucial economic data from the United States. GDP figures for the first quarter of 2024 missed estimates, increasing speculation that the US Fed could lower borrowing costs.
Ethereum could remain inside key range as Consensys sues SEC over ETH security status

Ethereum appears to have returned to its consolidating move on Thursday, canceling rally expectations. This comes after Consensys filed a lawsuit against the US SEC and insider sources informing Reuters of the unlikelihood of a spot ETH ETF approval in May.
Bank of Japan expected to keep interest rates on hold after landmark hike

The Bank of Japan is set to leave its short-term rate target unchanged in the range between 0% and 0.1% on Friday, following the conclusion of its two-day monetary policy review meeting for April. The BoJ will announce its decision on Friday at around 3:00 GMT.