EUR/USD Current price: 1.2914
View Live Chart for the EUR/USD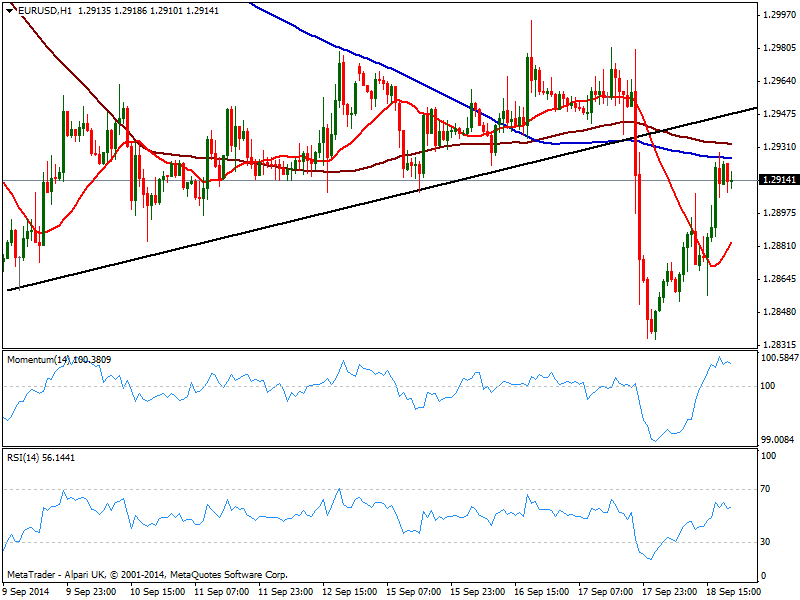
A long day is not yet over, with Scottish referendum outcome still pending, with the final result expected early Friday. At the end, it was not a good day for safe havens, with dollar mildly down across the board and yen being probably the weakest, as per US rising yields and stocks, with DJIA at fresh record highs. In Europe, there were no news to affect the market besides SNB rate decision, while in the US, data resulted weaker than expected, with housing starts and Philadelphia manufacturing index missing expectations and helping the dollar on its way back.
Nevertheless, the EUR/USD recovery was quite shallow, rising as much as 1.2928 intraday: the hourly chart shows both 100 and 200 SMAs around the level, offering intraday resistance, while indicators lost their earlier upward strength and turn lower above their midlines. In the 4 hours chart 20 SMA caps the upside around 1.2925 while indicators corrected oversold readings and remain below their midlines. Price stands now unable to regain the base of these last days range, which keeps the risk to the downside. A recovery next to extend beyond 1.2950 to deny a bearish continuation in the short term, while a downward acceleration below 1.2860 should open doors for further slides this Friday.
Support levels: 1.2860 1.2825 1.2790
Resistance levels: 1.2920 1.2950 1.2990
EUR/JPY Current price: 140.45
View Live Chart for the EUR/JPY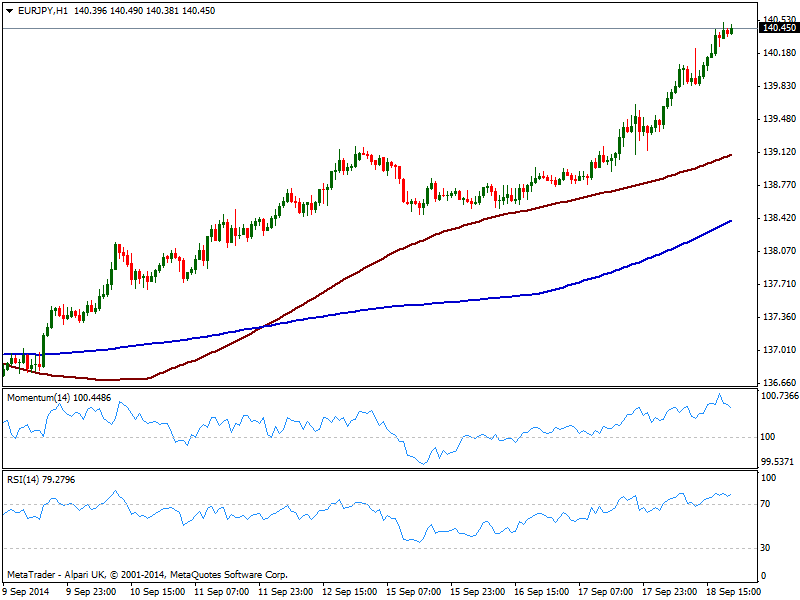
The yen bearish momentum seems to have resumed after FED despite the Central Bank hardly changed its stance this Wednesday, with the EUR/JPY reaching 140.40 critical level, not seen since mid May this year. The 1 hour chart shows indicators losing upward strength in overbought territory, but price pressuring the highs, which leaves little room for a downward correction. In the same time frame, 100 SMA stands now around 139.20, and as long as above it, downward movements should be understood as corrective, with risk still to the upside. In the 4 hours chart indicators maintain a strong upward momentum despite in overbought territory, supporting further advances up to 141.20 price zone.
Support levels: 140.00 139.60 139.20
Resistance levels: 140.80 141.20 142.55
GBP/USD Current price: 1.6375
View Live Chart for the GBP/USD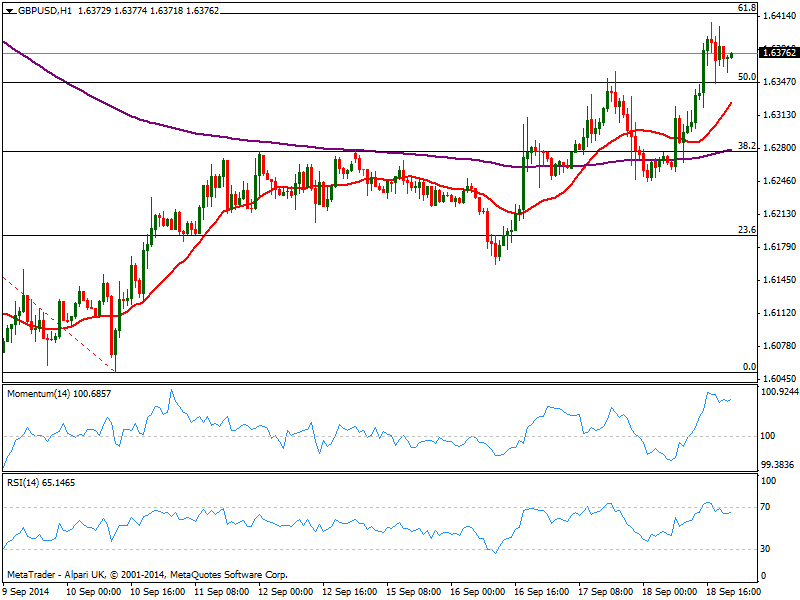
Market prices in a NO winning in Scotland since early polls shown a little advantage on that side, but for the most, the GBP/USD is in wait and see mode. The pair continues to work around Fibonacci levels, with the air holding above the 50% retracement of this September slide, but unable to extend beyond the 61.8% retracement of the same rally around 1.6410. In the 1hour chart, indicators corrected partially overbought readings but maintain a positive tone, while 20 SMA heads strongly up below current price. In the 4 hours chart momentum stands vertical while 20 SMA converges with the 38.2% retracement at 1.6250. But technical analysis has little to do this Friday, will the upcoming moves dependant of the result of the referendum. A NO has been mostly price in, with the pair probably adding 100 pips on the news; a YES however, will be a shock and the nose dive of GBP/USD can hardly be anticipated, but no doubts will exceed by long the opposite probable result.
Support levels: 1.6345 1.6310 1.6250
Resistance levels: 1.6410 1.6470 1.6540
USD/JPY Current price: 108.73
View Live Chart for the USD/JPY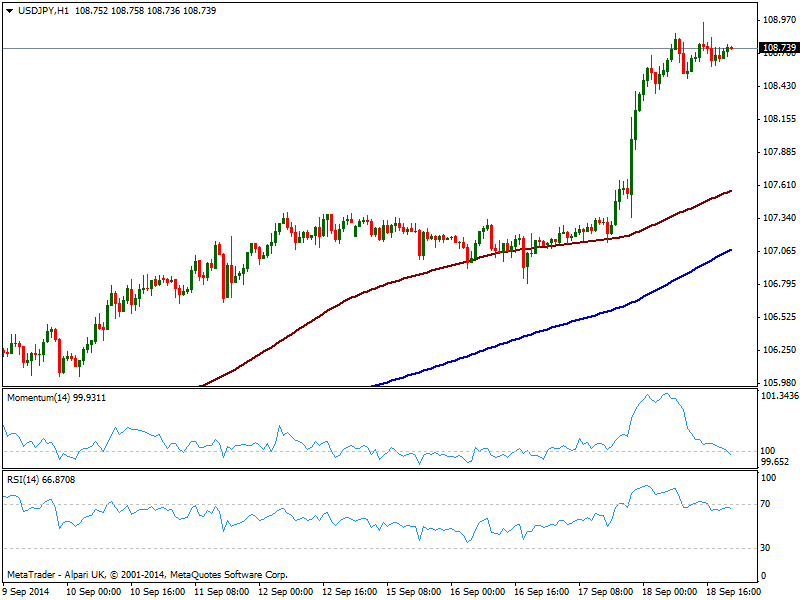
The USD/JPY consolidates near its multi-year high of 108.95, with short term buyers surging intraday at 108.55 immediate support. The hourly chart shows indicators correcting lower with momentum around 100 and RSI right below 70, but with price not following, risk remains to the upside. In the 4 hours chart indicators head north despite in overbought territory, all of which supports a continued advance: a break through 109.10 immediate resistance should lead to an advance up to 110.00 critical figure.
Support levels: 108.55 108.10 107.70
Resistance levels: 109.10 109.40 109.75
AUD/USD Current price: 0.8982
View Live Chart of the AUD/USD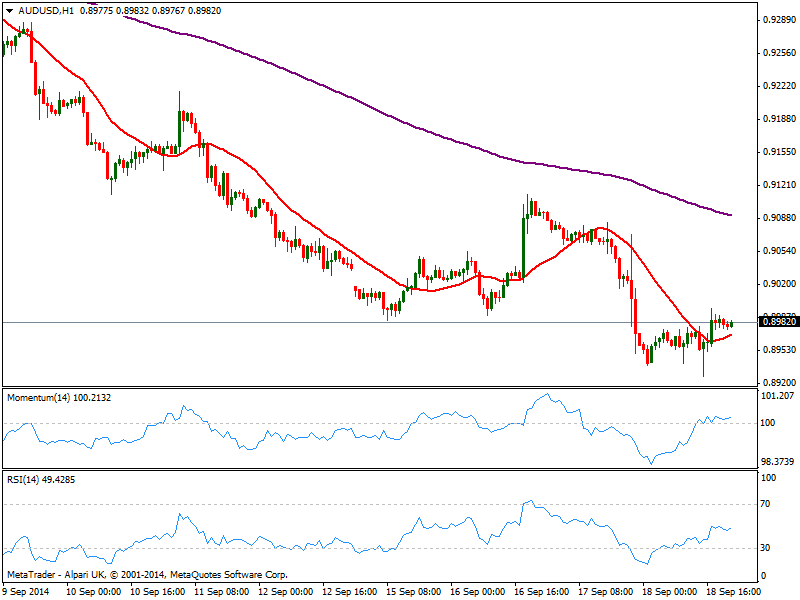
Australian dollar remains unable to regain the 0.9000 level against the greenback, with the pair recovering from a fresh low of 0.8926 posted early US session. The hourly chart shows price a few pips above a flat 20 SMA and indicators above their midlines, all of them lacking strength at the time being. In the 4 hours chart price develops well below its 20 SMA while indicators remain directionless in negative territory. As the rest of the majors, the pair may suffer some on the Scottish referendum outcome, albeit the effect should be quite shallow.
Support levels: 0.8955 0.8920 0.8880
Resistance levels: 0.8990 0.8940 0.8985
Recommended Content
Editors’ Picks
EUR/USD regains traction, recovers above 1.0700

EUR/USD regained its traction and turned positive on the day above 1.0700 in the American session. The US Dollar struggles to preserve its strength after the data from the US showed that the economy grew at a softer pace than expected in Q1.
GBP/USD returns to 1.2500 area in volatile session

GBP/USD reversed its direction and recovered to 1.2500 after falling to the 1.2450 area earlier in the day. Although markets remain risk-averse, the US Dollar struggles to find demand following the disappointing GDP data.
Gold climbs above $2,340 following earlier drop

Gold fell below $2,320 in the early American session as US yields shot higher after the data showed a significant increase in the US GDP price deflator in Q1. With safe-haven flows dominating the markets, however, XAU/USD reversed its direction and rose above $2,340.
XRP extends its decline, crypto experts comment on Ripple stablecoin and benefits for XRP Ledger

Ripple extends decline to $0.52 on Thursday, wipes out weekly gains. Crypto expert asks Ripple CTO how the stablecoin will benefit the XRP Ledger and native token XRP.
After the US close, it’s the Tokyo CPI

After the US close, it’s the Tokyo CPI, a reliable indicator of the national number and then the BoJ policy announcement. Tokyo CPI ex food and energy in Japan was a rise to 2.90% in March from 2.50%.