EUR/USD Current price: 1.2958
View Live Chart for the EUR/USD
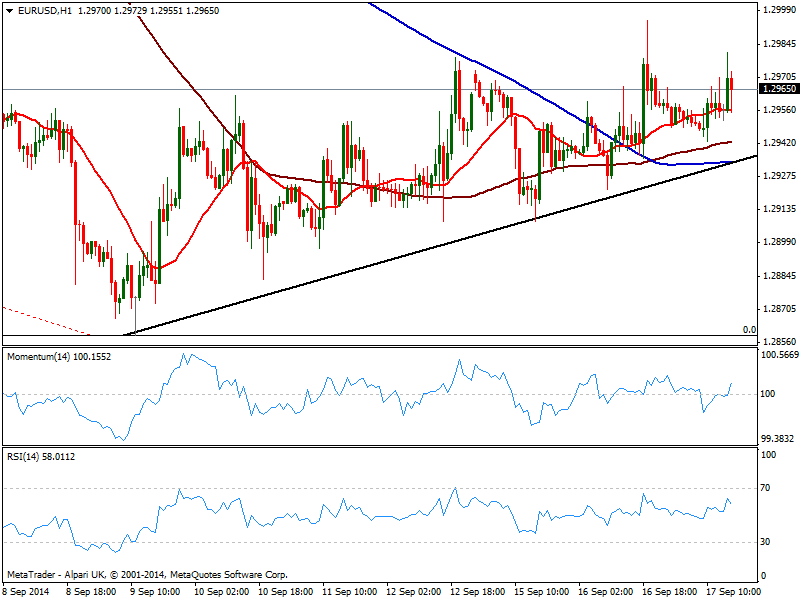
Dollar lost ground across the board after inflation in the US resulted negative monthly basis down to -0.2% first time below 0.0% since October 2013, but market movements remain limited ahead of FED economic policy decision later on the day. The EUR/USD retraces from a high of 1.2980 finding short term sellers on approaches to the 1.3000 figure; the 1 hour chart shows no directional strength coming from technical readings as it has been over the past sessions, with all eyes now placed on the outcome of the FED meeting: levels to watch then will be 1.3000 figure to the upside, or 1.2880 to the downside as a break of either extreme will likely set the trend for the upcoming days.
Support levels: 1.2950 1.2910 1.2870
Resistance levels: 1.2990 1.3045 1.3080
GBP/USD Current price: 1.6329
View Live Chart for the GBP/USD
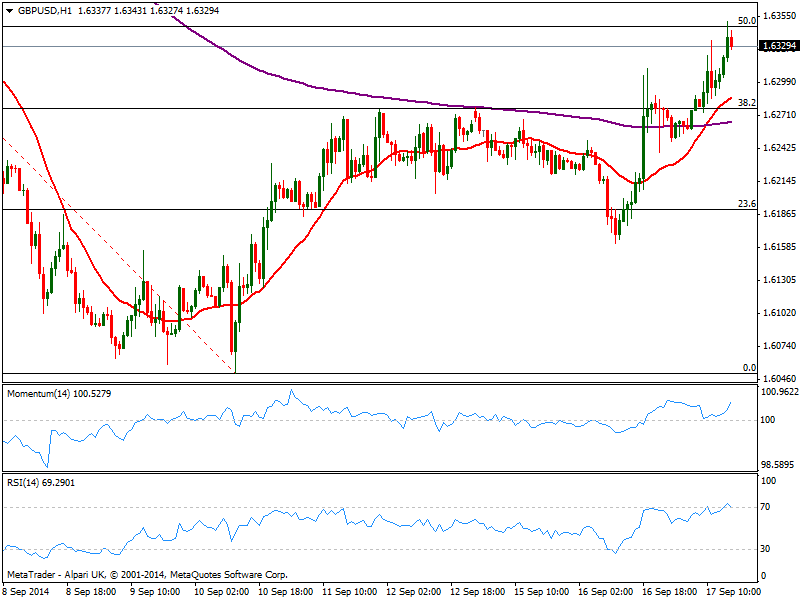
The GBP/USD extends its early gains in the US session, advancing so far up to 1.6351, helped by improved employment figures in the UK. The pair has not only filled the gap left 2 weeks ago, but also extended up to the 50% retracement of this September slide, maintaining an overall positive tone in the short term: the hourly chart shows price well above its 20 SMA and indicators grinding higher in positive territory. In the 4 hours chart momentum heads north above 100 with chances of an extension up to 1.6420 if the FED disappoints market.
Support levels: 1.6315 1.6250 1.6220
Resistance levels: 1.6350 1.6385 1.6420
USD/JPY Current price: 107.28
View Live Chart for the USD/JPY
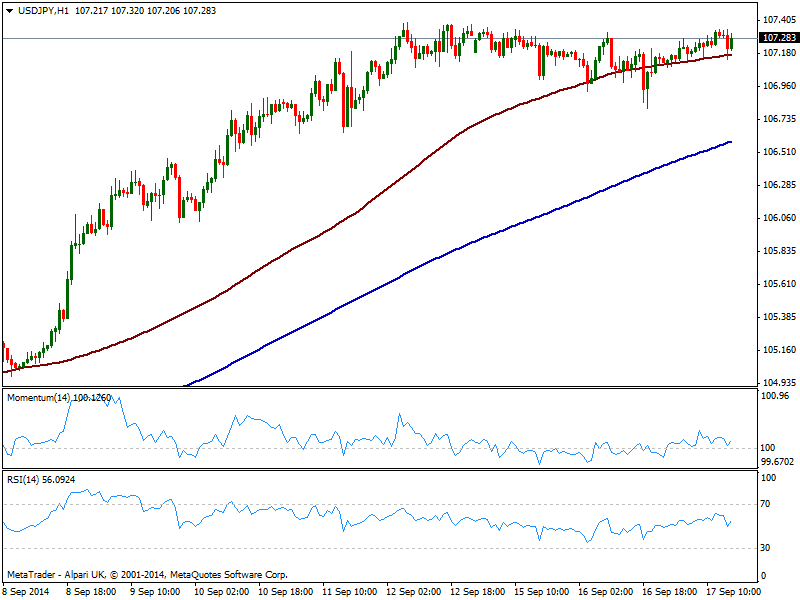
The USD/JPY short term downward move after worse than expected US data, was not enough to approach to 107.00, with the pair barely 10 pips away from its recent highs. The 1 hour chart however, maintains a quite neutral stance as per recent tight 40 pips range, with price holding above its 100 SMA. In the 4 hours chart indicators also turned flat with momentum around 100, with investors now in wait and see mode.
Support levels: 106.80 106.50 106.10
Resistance levels: 107.40 107.90 108.20
AUD/USD Current price: 0.9060
View Live Chart of the AUD/USD
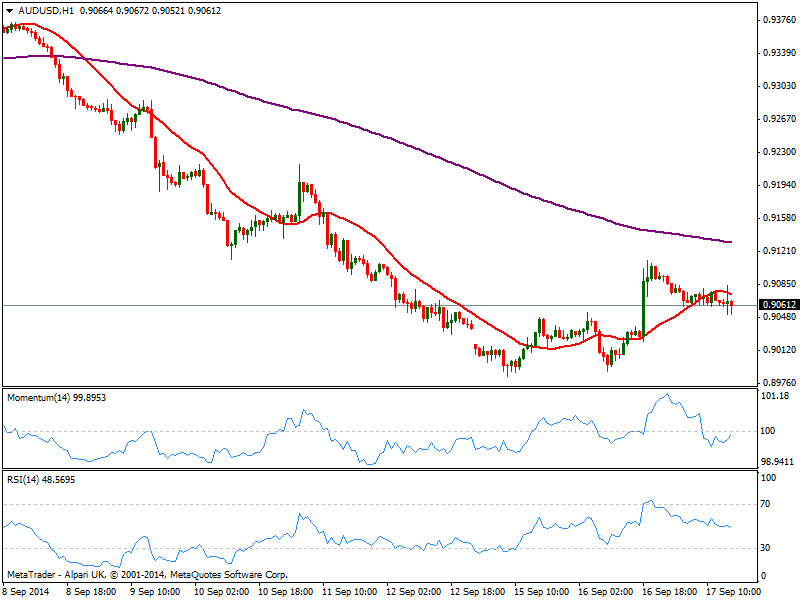
The AUD/USD retraces from its highs around 0.9110 posted yesterday, with the pair pressuring now former resistance area now immediate support of 0.9050. The 1 hour chart shows price below 20 SMA and indicators below their midlines, albeit showing no downward strength at the time being. In the 4 hours chart indicators maintain a positive tone, with momentum heading higher above 100 and 20 SMA offering support around 0.9040.
Support levels: 0.9040 0.8990 0.8955
Resistance levels: 0.9110 0.9150 0.9190
Recommended Content
Editors’ Picks
EUR/USD holds steady near 1.0650 amid risk reset

EUR/USD is holding onto its recovery mode near 1.0650 in European trading on Friday. A recovery in risk sentiment is helping the pair, as the safe-haven US Dollar pares gains. Earlier today, reports of an Israeli strike inside Iran spooked markets.
GBP/USD recovers toward 1.2450 after UK Retail Sales data

GBP/USD is rebounding toward 1.2450 in early Europe on Friday, having tested 1.2400 after the UK Retail Sales volumes stagnated again in March, The pair recovers in tandem with risk sentiment, as traders take account of the likely Israel's missile strikes on Iran.
Gold price defends gains below $2,400 as geopolitical risks linger

Gold price is trading below $2,400 in European trading on Friday, holding its retreat from a fresh five-day high of $2,418. Despite the pullback, Gold price remains on track to book the fifth weekly gain in a row, supported by lingering Middle East geopolitical risks.
Bitcoin Weekly Forecast: BTC post-halving rally could be partially priced in Premium

Bitcoin price shows no signs of directional bias while it holds above $60,000. The fourth BTC halving is partially priced in, according to Deutsche Bank’s research.
Geopolitics once again take centre stage, as UK Retail Sales wither

Nearly a week to the day when Iran sent drones and missiles into Israel, Israel has retaliated and sent a missile into Iran. The initial reports caused a large uptick in the oil price.