EUR/USD Current price: 1.2942
View Live Chart for the EUR/USD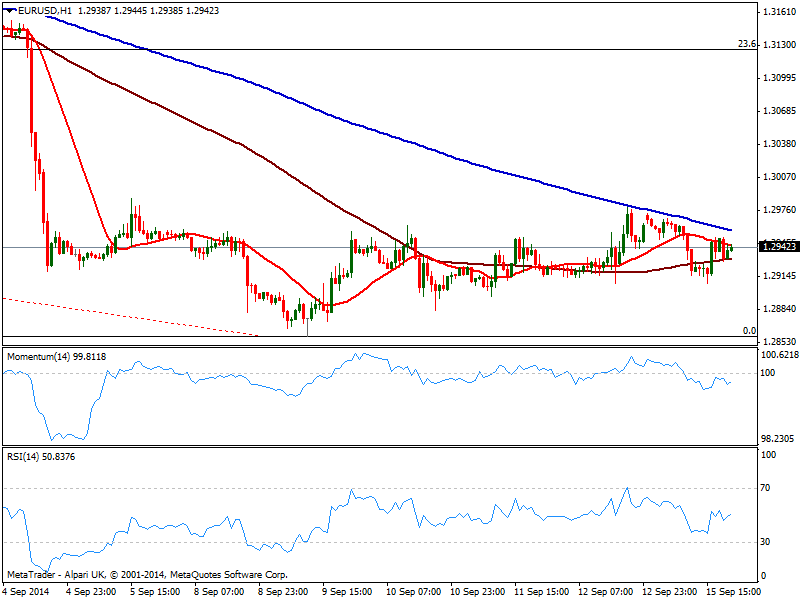
Back and forth, the EUR/USD traded in the 1.2910/80 range all through this Monday, lead mostly by stocks, rather than data. In Europe the Trade Balance presented a worse than expected surplus of 12.2B, while in the US data came out mixed: New York manufacturing index rose to 27.5 multi years high, but industrial production print a sad -0.1% forcing dollar down after a limited rally against the EUR down to 1.2908.
Technically, the pair has presented little progress over this last 24 hours, with the hourly chart showing price between 100 and 200 SMAs, just 30 pips away from each other, which clearly reflects the lack of directional strength. Indicators stand flat below their midlines, while the 4 hours chart presents a neutral stance, with price moving back and forth around its 20 SMA and indicators stuck around their midlines. Nevertheless, bears maintain full control of the pair, now waiting for more light coming from the FED to decide whether to extend the bearish trend.
Support levels: 1.2910 1.2870 1.2835
Resistance levels: 1.2950 1.2990 1.3045
EUR/JPY Current price: 138.66
View Live Chart for the EUR/JPY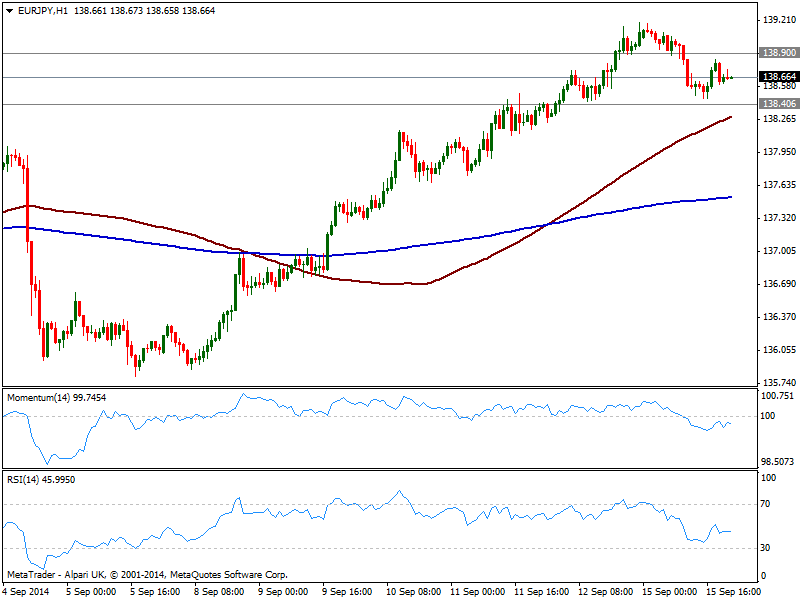
Japanese yen gained some ground against most rivals, with the EUR/JPY down to 138.46, where it found short term buyers, albeit trading now below 138.90 immediate resistance. The 1 hour chart shows 100 SMA advancing below current price, a few pips below 138.40 immediate static support, with indicators turning lower below their midlines. In the 4 hours chart momentum heads lower but holds above 100 while RSI regained the upside above 50, limiting chances of further slides. At this point, price needs to recover above mentioned resistance to be able to regain previous positive tone, yet if 138.40 gives up, the bearish potential will increase eyeing an approach to the 137.60/70 price zone.
Support levels: 138.40 138.00 137.65
Resistance levels: 138.90 139.30 139.70
GBP/USD Current price: 1.6228
View Live Chart for the GBP/USD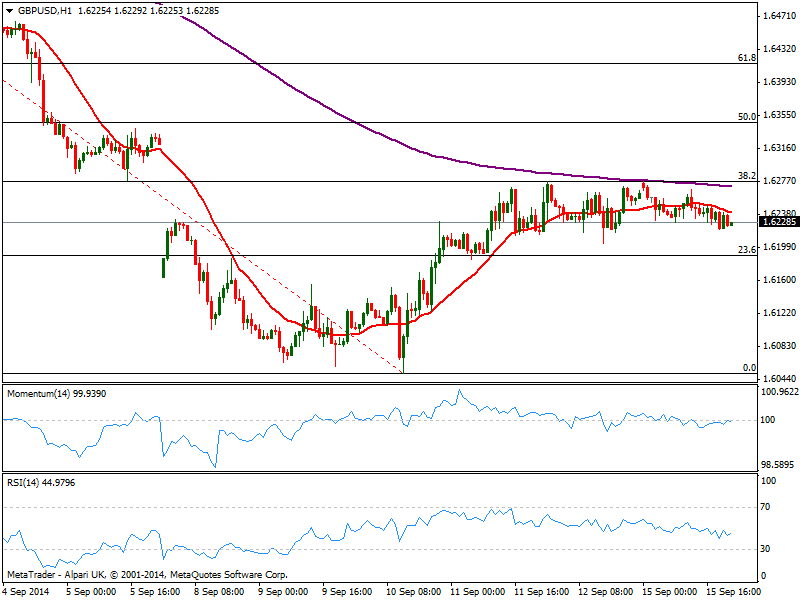
No changes for the GBP/USD that awaits for critical UK data later this week, inflation on Tuesday, employment on Friday, and the Scottish referendum on Thursday. At this point, the pair continues to be trapped between Fibonacci levels of this month bearish run measured from 1.6643 to 1.6067: the 38.2% retracement of such movement caps the upside around 1.6280, while the pair holds above the 23.6% retracement, offering support at 1.6190. The 1 hour chart shows indicators with a mild bearish slope but in neutral territory, while in the 4 hours chart price hovers around a still bullish 20 SMA as indicators crosses its midline to the downside, adding to the bearish case: a break below mentioned 1.6190 however, is required to confirm a more steady intraday decline towards 1.6140/50 price zone.
Support levels: 1.6220 1.6190 1.6150
Resistance levels: 1.6280 1.6320 1.6350
USD/JPY Current price: 107.18
View Live Chart for the USD/JPY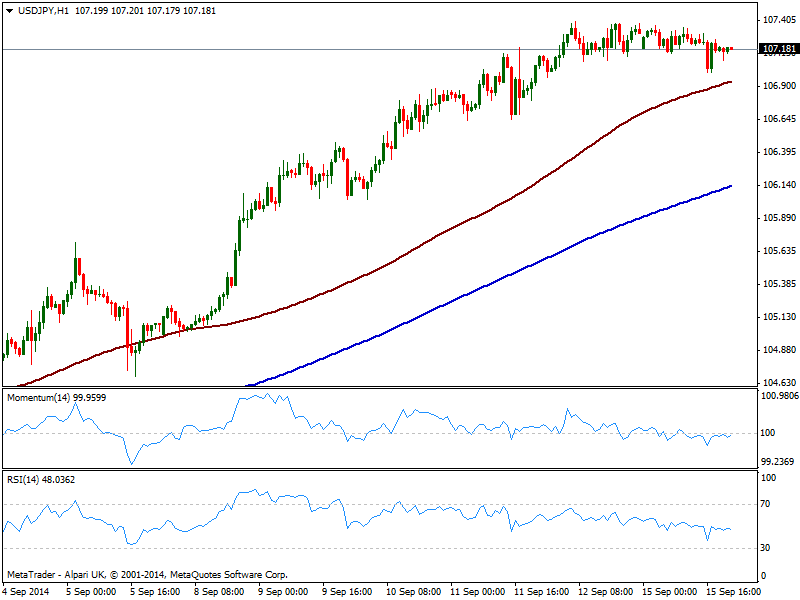
Worse than expected US data sent USD/JPY to an intraday low of 107.00, but the movement was short lived and the pair trades back a few pips below its recent high of 107.38. The tight range however has left the short term picture with a quite neutral stance, as per indicators horizontal around their midlines. 100 SMA stands now at 106.90 acting as first probable intraday support, while 200 SMA is way below at 106.20, the line in the sand in case of a bearish acceleration in the pair, as only below it current bullish trend may suffer. In the 4 hours chart RSI reentered below 70 but momentum regains the upside above 100, which limits chances of a downward move. To the upside, 107.40 is the level to break to see the bullish trend resuming towards 108.00 price zone.
Support levels: 106.80 106.50 106.10
Resistance levels: 107.40 107.90 108.20
AUD/USD Current price: 0.903
View Live Chart of the AUD/USD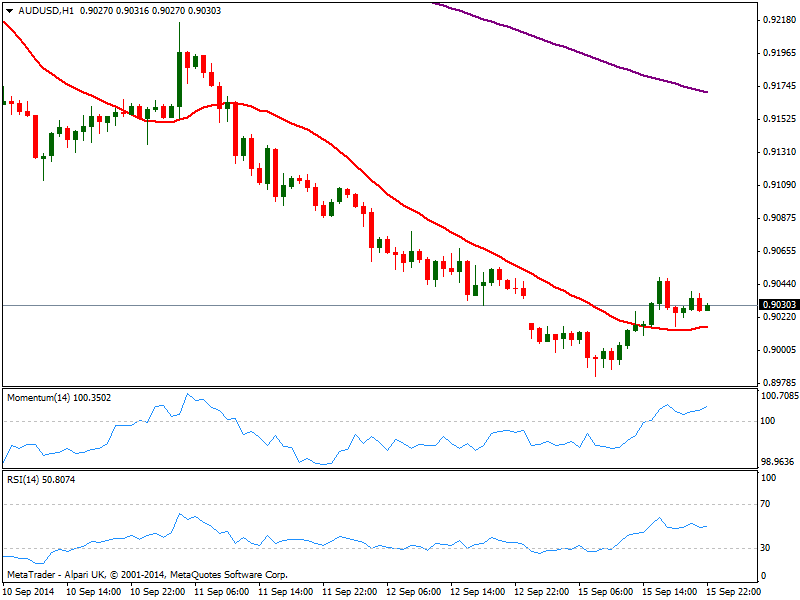
The AUD/USD finally closed the weekly opening gap after falling down to 0.8983, but failed to extend gains beyond 0.9050. The 1 hour chart shows price above its 20 SMA while indicators aim higher in positive territory. The 4 hours chart however, shows a strongly bearish 20 SMA above current price and indicators barely correcting oversold readings, which hardly suggest a steadier recovery. At this point, risk remains to the downside, with another attempt below 0.9000 probably extending to new lows, eyeing 0.8920 as a probable bearish target for this Tuesday.
Support levels: 0.9000 0.8960 0.8920
Resistance levels: 0.9050 0.9075 0.9110
Recommended Content
Editors’ Picks
EUR/USD retreats toward 1.0650 after PMI-inspired rebound

EUR/USD loses traction and retreats to the 1.0650 area after rising toward 1.0700 with the immediate reaction to the upbeat PMI reports from the Eurozone and Germany. The cautious market stance helps the USD hold its ground ahead of US PMI data.
GBP/USD fluctuates near 1.2350 after UK PMIs

GBP/USD clings to small daily gains near 1.2350 in the European session on Tuesday. The data from the UK showed that the private sector continued to grow at an accelerating pace in April, helping Pound Sterling stay resilient against its rivals.
Gold flirts with $2,300 amid receding safe-haven demand

Gold (XAU/USD) remains under heavy selling pressure for the second straight day on Tuesday and languishes near its lowest level in over two weeks, around the $2,300 mark in the European session. Eyes on US PMI data.
Here’s why Ondo price hit new ATH amid bearish market outlook Premium

Ondo price shows no signs of slowing down after setting up an all-time high (ATH) at $1.05 on March 31. This development is likely to be followed by a correction and ATH but not necessarily in that order.
US S&P Global PMIs Preview: Economic expansion set to keep momentum in April

S&P Global Manufacturing PMI and Services PMI are both expected to come in at 52 in April’s flash estimate, highlighting an ongoing expansion in the private sector’s economic activity.