EUR/USD Current price: 1.3194
View Live Chart for the EUR/USD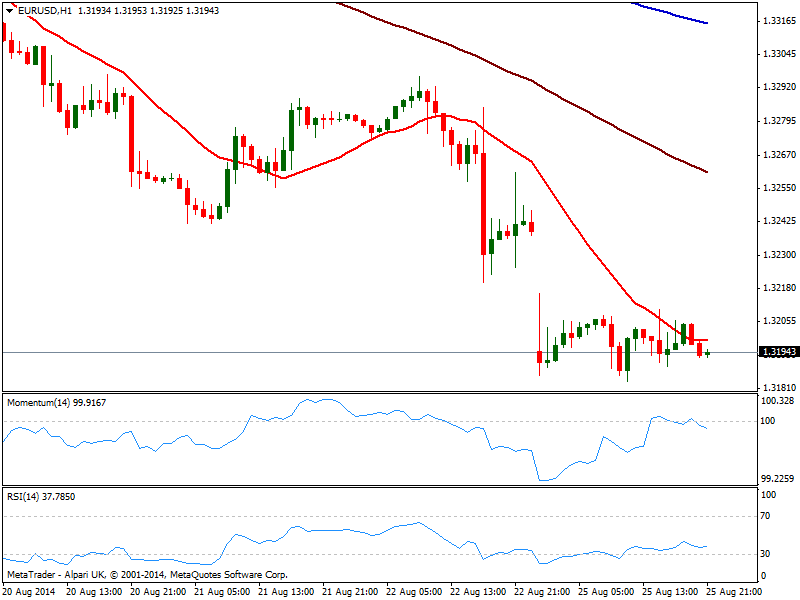
The EUR/USD has been the only pair unable to fill the weekly opening gap, as even its twin brother USD/CHF has saw a kneejerk down, edging 5 pips away from Friday’s close. Stuck around 1.3200, the pair has been trading a handful of pips either side of the level for most of the day, posting however a lower low for the year of 1.3183. Data has disappointed both sides of the Atlantic, with German IFO survey showing another drop in confidence amongst Europeans, and US Services PMI posting a slower rise, down to 58.5 while New Home Sales unexpectedly fall to a 4 month low. But with London closed on holiday, the pair was unable to react during European hours, and remained subdue in the US session.
Technically the bearish pressure remains in place, with the short term picture neutral as per the lack of definitions over the last 24 hours: the hourly chart shows price right below its 20 SMA and indicators barely turning lower around their midlines. In the 4 hours chart momentum turned south well into negative territory, while RSI holds steady in oversold levels as 20 SMA extended lower, now offering dynamic resistance around 1.6250.
Support levels: 1.3185 1.3150 1.3120
Resistance levels: 1.3215 1.3250 1.3270
EUR/JPY Current price: 137.17
View Live Chart for the EUR/JPY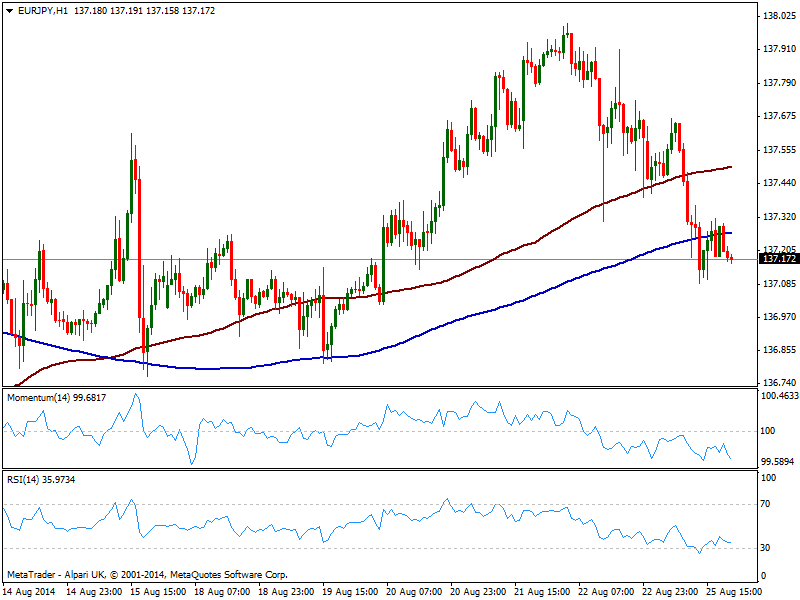
As expected, the EUR/JPY suffered some bearish pressure, holding however above the 137.00 mark. Stocks soared in Europe closing up with strong gains, while US indexes posting more modest gains on Monday, but not before S&P surpassed 2000 first time ever. Nevertheless, yen gained against its rivals, more on profit taking and EUR general weakness than anything else. As for the EUR/JPY the hourly chart shows price now below both 100 and 200 SMAs, with the last offering some intraday resistance around 137.25 and indicators heading south below their midlines. In the 4 hours chart technical indicators present a strong downward momentum, supporting further slides on a break below the 136.90 support level.
Support levels: 136.90 136.40 136.00
Resistance levels: 137.35 137.60 138.00
GBP/USD Current price: 1.6578
View Live Chart for the GBP/USD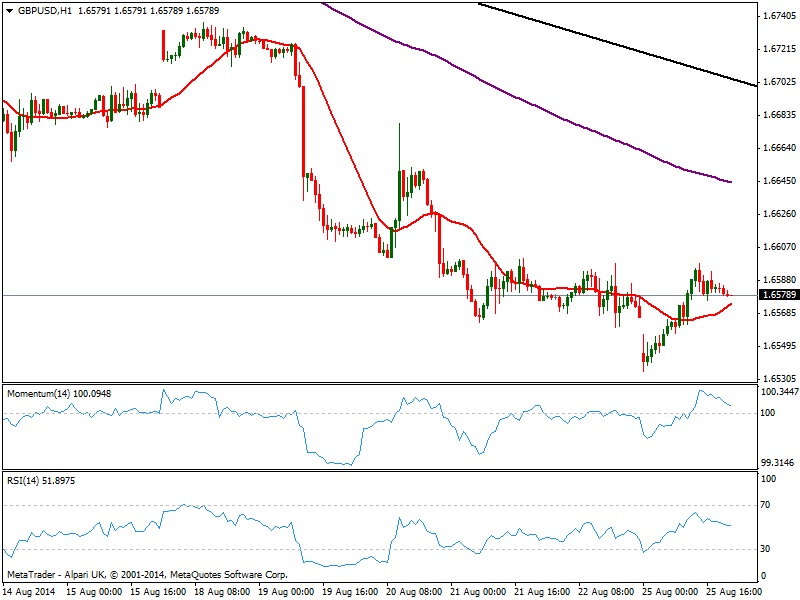
The GBP/USD advance some on the day, unable to however to overcome the 1.6600 level, still acting as immediate short term resistance. The hourly chart shows price managed to recover above its 20 SMA that anyway remains flat a few pips below current price, while indicators turn lower towards their midline, holding for now in positive territory. In the 4 hours chart price stalled right at a bearish 20 SMA, as indicators turn south around their midlines, suggesting there’s little room for a steady recovery. Renewed selling interest below the 1.6540 is required however, to confirm a new leg down, still eyeing 1.6465, March this year monthly low.
Support levels: 1.6540 1.6490 1.6465
Resistance levels: 1.6600 1.6630 1.6680
USD/JPY Current price: 103.99
View Live Chart for the USD/JPY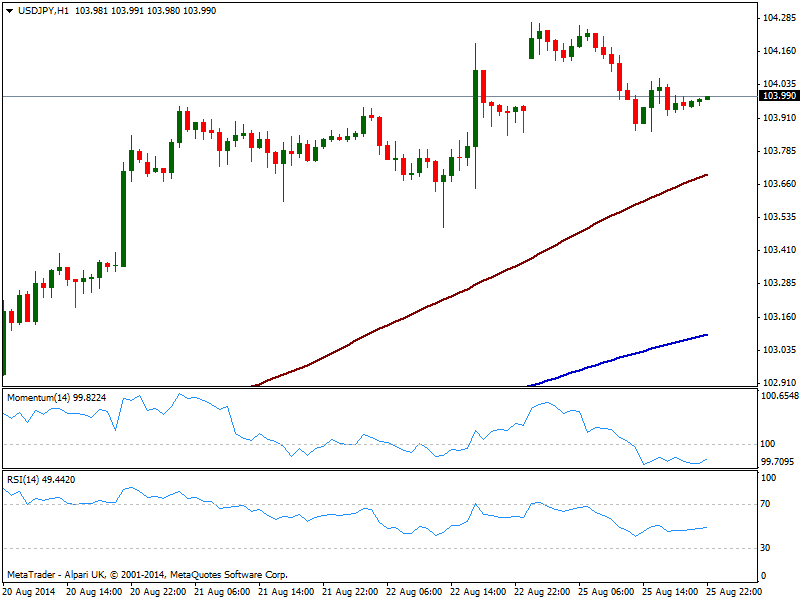
The USD/JPY fell down to 103.85 intraday, closing the weekly opening gap but consolidating around 104.00 for most of the last session. Technically, the hourly chart shows indicators mostly flat below their midlines, with price however well above 100 and 200 SMAs, both presenting steady upward slopes below current price. In the 4 hours chart indicators corrected overbought readings, now slowly grinding higher in positive territory, suggesting the downside will remain limited. Immediate support stands at mentioned 1 hour 100 SMA, currently at 103.70, and if the level holds on dips, the upside will remain favored.
Support levels: 103.70 103.20 102.85
Resistance levels: 104.10 104.45 104.80
AUD/USD Current price: 0.9294
View Live Chart for the AUD/USD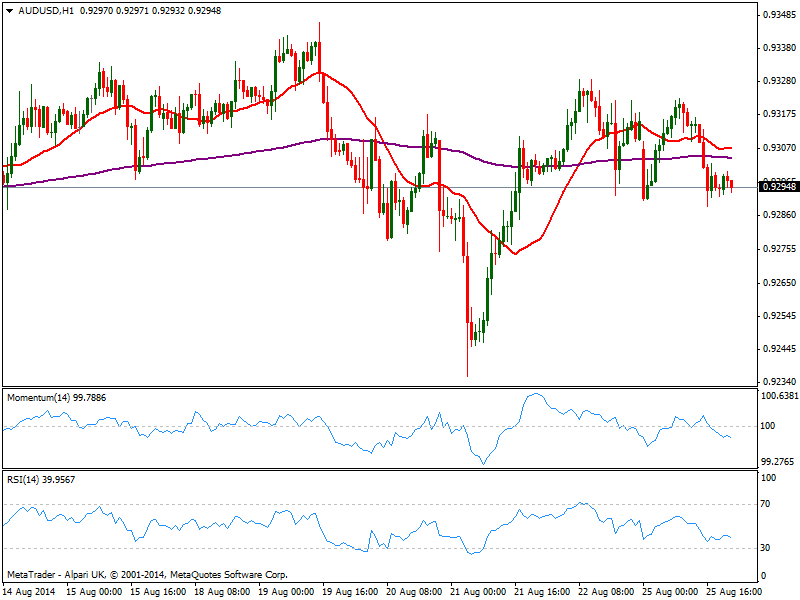
The AUD/USD has been trading in a quite limited range, with the upside capped by 0.9330 strong static resistance level, as an early approach to it resulted in a quick slide right below the 0.9300 mark. Nevertheless the pair has shown little follow through, consolidating around the figure for most of the last session. Technically, the hourly chart shows a mild bearish tone coming from indicators, with price below a flat 20 SMA and indicators grinding lower below their midlines. In the 4 hours chart price hovers around an also flat 20 SMA while indicators lost their upward potential and turned south approaching their midlines. A break through 0.9260 however, is required to confirm some downward continuation, while above 0.9330 the pair can surprise with a recovery up to 0.9370 price zone.
Support levels: 0.9260 0.9220 0.9180
Resistance levels: 0.9330 0.9370 0.9410
Recommended Content
Editors’ Picks
AUD/USD remained bid above 0.6500

AUD/USD extended further its bullish performance, advancing for the fourth session in a row on Thursday, although a sustainable breakout of the key 200-day SMA at 0.6526 still remain elusive.
EUR/USD faces a minor resistance near at 1.0750

EUR/USD quickly left behind Wednesday’s small downtick and resumed its uptrend north of 1.0700 the figure, always on the back of the persistent sell-off in the US Dollar ahead of key PCE data on Friday.
Gold holds around $2,330 after dismal US data

Gold fell below $2,320 in the early American session as US yields shot higher after the data showed a significant increase in the US GDP price deflator in Q1. With safe-haven flows dominating the markets, however, XAU/USD reversed its direction and rose above $2,340.
Bitcoin price continues to get rejected from $65K resistance as SEC delays decision on spot BTC ETF options

Bitcoin (BTC) price has markets in disarray, provoking a broader market crash as it slumped to the $62,000 range on Thursday. Meanwhile, reverberations from spot BTC exchange-traded funds (ETFs) continue to influence the market.
US economy: slower growth with stronger inflation

The dollar strengthened, and stocks fell after statistical data from the US. The focus was on the preliminary estimate of GDP for the first quarter. Annualised quarterly growth came in at just 1.6%, down from the 2.5% and 3.4% previously forecast.