EUR/USD Current price: 1.3316
View Live Chart for the EUR/USD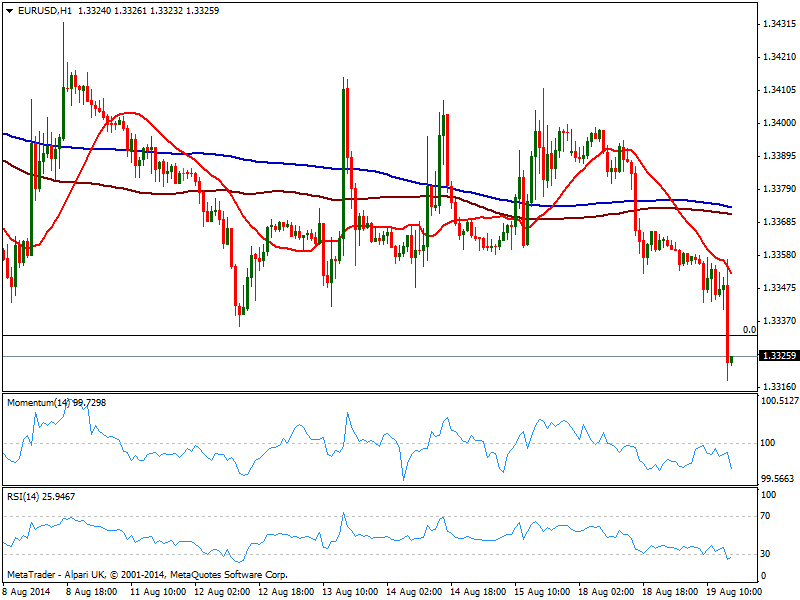
The dollar stood as the overall winner on Tuesday, strongly up against most rivals and finally gaining track against commodity currencies late US session. The initial trigger for the rally came with better than expected housing readings in the US and despite inflation steadied at 2% yearly basis. Weaker numbers in the EZ and the UK earlier on the day indeed helped European currencies on their way down, along with strong slides in commodities.
As for the EUR/USD the pair is about to close the day at its lowest level since November last year, with immediate support at 1.3295, mentioned month low. Short term, the hourly chart shows the strong bearish momentum prevails despite indicators are at oversold levels, with price now well below moving averages. In the 4 hours chart momentum heads strongly south below its midline, whilst 20 SMA gains bearish slope above current price, all of which supports the shorter term view. Pullbacks will now found sellers in the 1.3330 area, and if the level holds, further slides towards 1.3250 should be expected.
Support levels: 1.3295 1.3250 1.3210
Resistance levels: 1.3330 1.3370 1.3405
EUR/JPY Current price: 137.02
View Live Chart for the EUR/JPY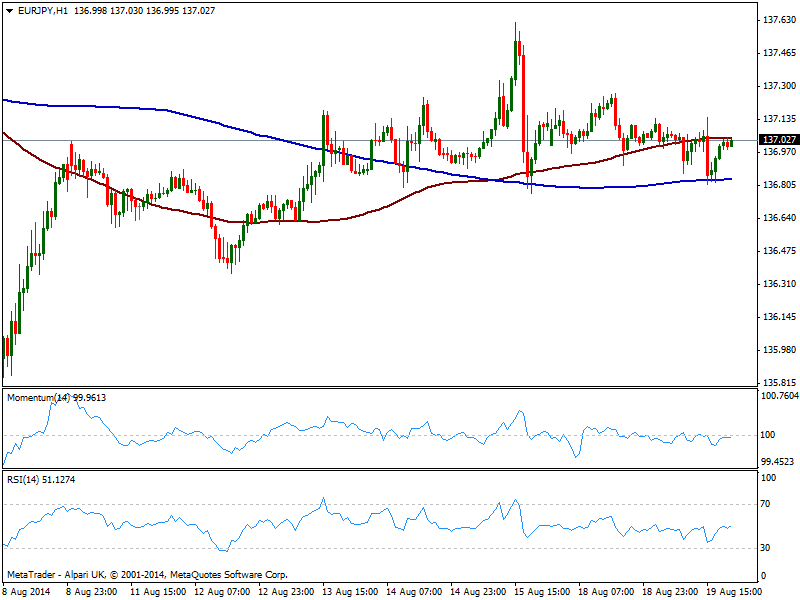
Unchanged on the day, the EUR/JPY holds steady around 137.00 as EUR and JPY weakness against mighty dollar keep the cross balanced. Stocks soaring in the US, with S&P a few points below its all time high, put extra pressure on yen. Technically however, the pair maintains a neutral stance in the short term, with the hourly chart showing price in between 100 and 200 SMA, with the shortest offering immediate resistance a few pips above current price, and indicators flat around their midlines. In the 4 hours chart the technical picture is also neutral to bearish, as momentum turned lower around its midline, with moving averages above current price. Key support stands now at 136.80, with a break below favoring some downward continuation as long as 137.60 continues to cap the upside.
Support levels: 136.80 136.40 135.90
Resistance levels: 137.30 137.60 138.00
GBP/USD Current price: 1.6613
View Live Chart for the GBP/USD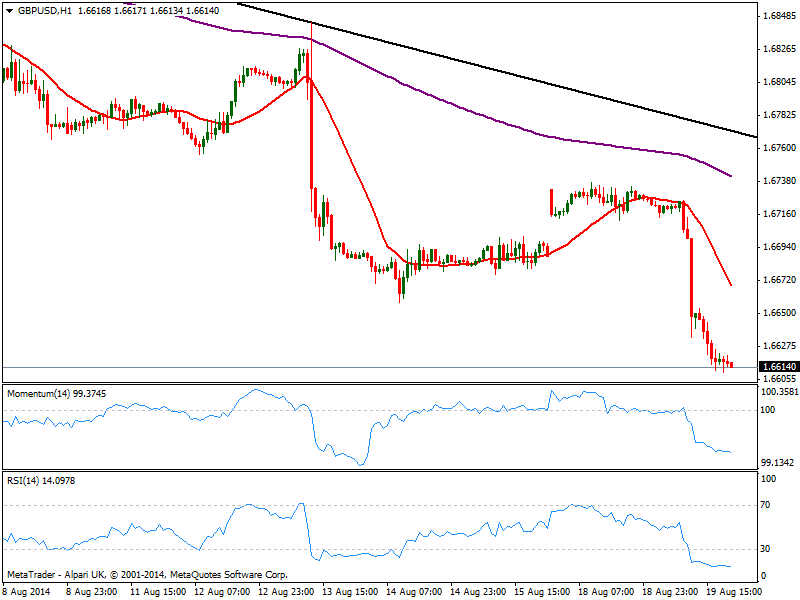
The GBP/USD trades at its lowest level in 4 months, having succumbed to poor inflation numbers in the UK, diminishing chances of a sooner rate hike in the kingdom. The pair has stalled right above 1.6600 where it stands, with the hourly chart showing indicators flat in extreme oversold levels, and 20 SMA gaining bearish slope above current price, currently offering dynamic resistance around 1.6660. In the 4 hours chart momentum maintains a strong bearish slope while RSI stands flat in oversold levels, far from suggesting a short term reversal. A price acceleration below 1.6610 should lead to a continued slide, eyeing 1.6540/60 area for this Wednesday.
Support levels: 1.6610 1.6580 1.6545
Resistance levels: 1.6650 1.6700 1.6740
USD/JPY Current price: 102.90
View Live Chart for the USD/JPY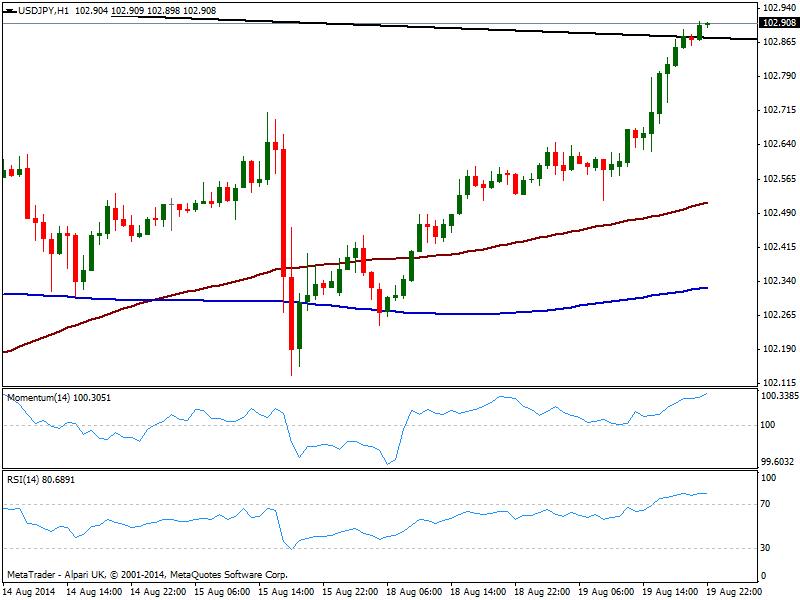
The USD/JPY extended its advance to a 3 week high in the US afternoon, trading right above a daily descendant trend line coming from this year high of 105.43. The hourly chart shows latest candle opened above the mentioned trend line, while indicators continue to head north despite in overbought territory; in the same time frame, moving average finally gain some upward slope while in bigger time frames, technical readings are also biased higher, supporting the shorter term view. With an intermediate resistance around 103.20, strong one comes at 103.75 price zone, where the pair presents several intraday highs. Finally, Nikkei stands around 15480 ahead of the opening, following their overseas counterparts: if the index extends its rally, yen will likely remain under pressure, favoring more USD/JPY gains.
Support levels: 102.35 101.95 101.60
Resistance levels: 103.20 103.75 104.10
AUD/USD Current price: 0.9305
View Live Chart for the AUD/USD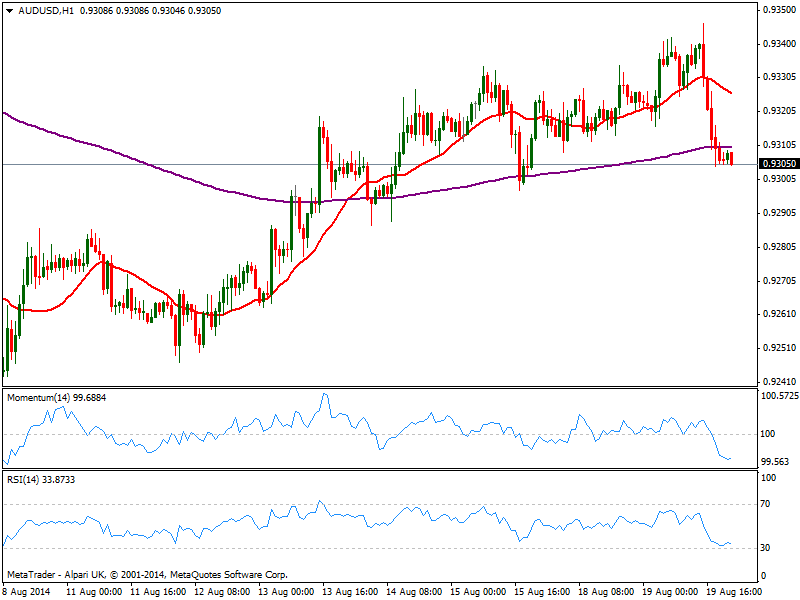
The AUD/USD holds above the 0.9300 mark, having shed early week gains on the back of dollar strength. For current Asian session, RBA Governor Stevens is expected to testify before a parliamentary committee today, and the overall sentiment is that he will be dovish as lately, trying to down talk Aussie. That should not come as a surprise, so the effect may be limited unless he surprise with extra dovish comments. Anyway and from a technical point of view, the pair presents a bearish tone, with the hourly chart showing price accelerated below its 20 SMA and indicators near oversold levels. In the 4 hours chart indicators crossed their midlines to the downside, while current candle opened below its 20 SMA, all of which supports some further downside towards 0.9260 price zone.
Support levels: 0.9300 0.9260 0.9220
Resistance levels: 0.9330 0.9370 0.9410
Recommended Content
Editors’ Picks
EUR/USD regains traction, recovers above 1.0700

EUR/USD regained its traction and turned positive on the day above 1.0700 in the American session. The US Dollar struggles to preserve its strength after the data from the US showed that the economy grew at a softer pace than expected in Q1.
GBP/USD returns to 1.2500 area in volatile session

GBP/USD reversed its direction and recovered to 1.2500 after falling to the 1.2450 area earlier in the day. Although markets remain risk-averse, the US Dollar struggles to find demand following the disappointing GDP data.
Gold holds around $2,330 after dismal US data

Gold fell below $2,320 in the early American session as US yields shot higher after the data showed a significant increase in the US GDP price deflator in Q1. With safe-haven flows dominating the markets, however, XAU/USD reversed its direction and rose above $2,340.
XRP extends its decline, crypto experts comment on Ripple stablecoin and benefits for XRP Ledger

Ripple extends decline to $0.52 on Thursday, wipes out weekly gains. Crypto expert asks Ripple CTO how the stablecoin will benefit the XRP Ledger and native token XRP.
After the US close, it’s the Tokyo CPI

After the US close, it’s the Tokyo CPI, a reliable indicator of the national number and then the BoJ policy announcement. Tokyo CPI ex food and energy in Japan was a rise to 2.90% in March from 2.50%.