EUR/USD Current price: 1.3409
View Live Chart for the EUR/USD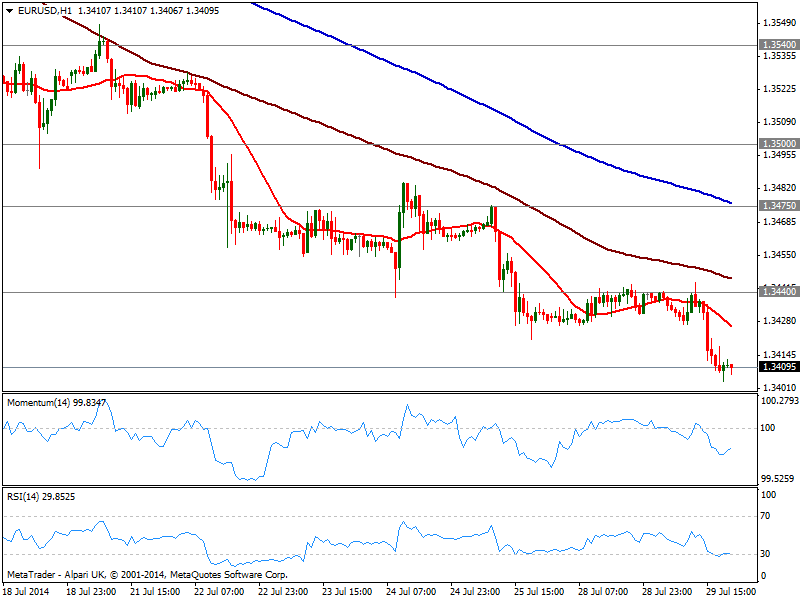
Action moved for once, from the stocks markets to the forex board, with greenback strengthening for most o the last two session and indexes flat on the day. The EUR/USD extended its decline to a fresh year low of 1.3402 on the day, with no news driving the movement but dollar demand ahead of key macro data on the upcoming days. Consumer confidence advanced some improvement in local economic conditions rising up to 90.9, levels not seen since 2007, but dollar gains began before the release.
Starting early Europe, Wednesday will be fulfilled with economic data both shores of the Atlantic that include European sentiment indexes, US ADP,GDP ad the FED to close the day. GDP readings will be closely watched, expected at 3.0% after the -2.9% of the first quarter of the day, and a positive number can be enough to boost the greenback, regardless what the Central Bank says later on the day. In fact, no surprises are expected to come from that front, with no press conference to accompany the decision. As for the EUR/USD, market sentiment is still strongly bearish, with the hourly chart showing indicators turning flat in oversold levels, anticipating some consolidation rather than a reversal in the short term. In the 4 hours chart technical readings also are bearish supportive, with short term sellers now in the 1.3440 price zone.
Support levels: 1.3410 1.3380 1.3335
Resistance levels: 1.3440 1.3475 1.3500
EUR/JPY Current price: 136.93
View Live Chart for the EUR/JPY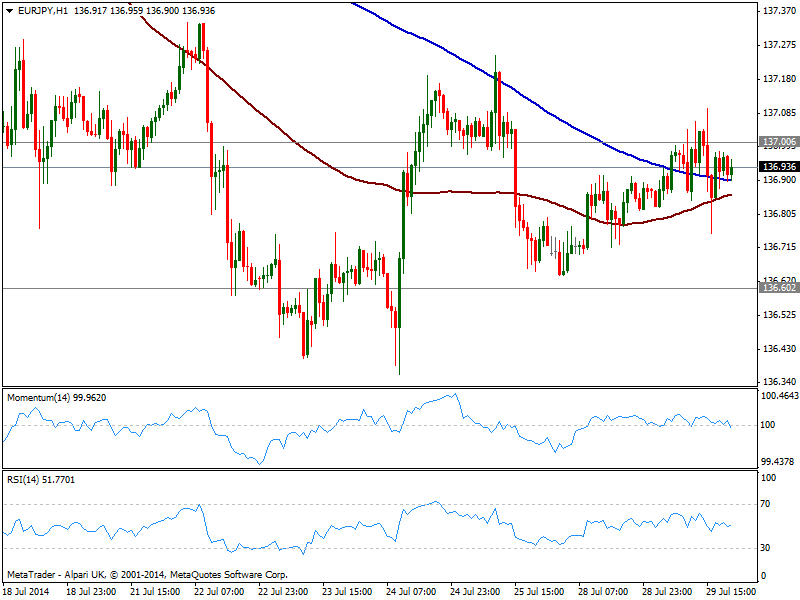
Yen weakness was not enough for EUR/JPY, unable to firm up above the 137.00 briefly tested during the US afternoon. Is the battle of the “less weak” in here, and the EUR is the one with less chances of emerging victorious on dollar rallies. Anyway and from a technical point of view, the hourly chart shows price along with 100 and 200 SMA all within a 10 pips range while indicators stand flat in neutral territory, all reflecting current lack of directional strength. In the 4 hours chart moving averages continue grinding lower well above current price while indicators are also flat in neutral territory: either a break below 136.60 or a firmer advance beyond 137.50 is required, to set a clear direction for the upcoming days.
Support levels: 136.90 136.60 136.20
Resistance levels: 137.50 137.90 138.40
GBP/USD Current price: 1.6938
View Live Chart for the GBP/USD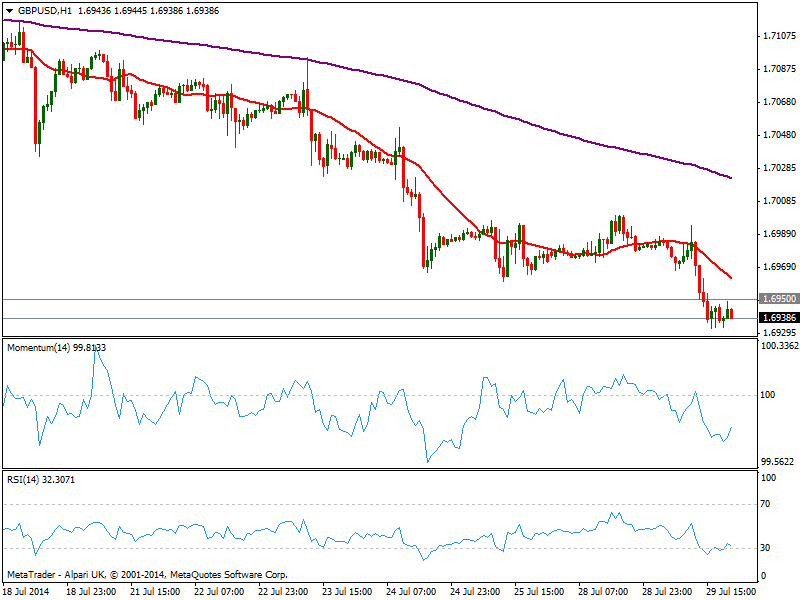
The GBP/USD fell steadily for most of the day, despite June UK mortgage approvals beat median forecast and rose up to 67.2K. The pair broke below former 1.6950 strong static support, but there was no follow through with price stagnated a few pips below mentioned level. As a new day starts, the hourly chart shows indicators correcting higher from oversold levels, while 20 SMA maintains a strong bearish slope above current price. In the 4 hours chart technical indicators also aim higher in negative territory, supporting some limited upward corrective movement that can extend up to 1.7000 without really affecting the dominant bearish tone.
Support levels: 1.6920 1.6870 1.6825
Resistance levels: 1.6950 1.7000 1.7045
USD/JPY Current price: 102.11
View Live Chart for the USD/JPY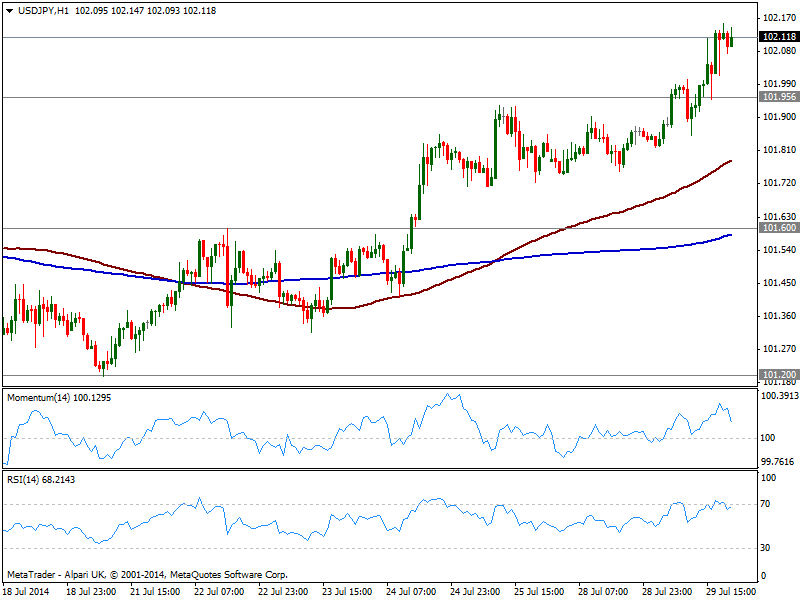
Trading at its daily highs, the USD/JPY closes the day above both, its 100 and 200 DMAs around 102.00/05 first time since mid June. That should be considered a quite nice bullish signal if it weren’t of NFP numbers coming on Friday. Nikkei upward strength, trading at levels not seen since late January this year is another factor supporting current yen weakness, albeit cautious should prevail until Friday. Technically, the hourly chart shows momentum corrected overbought levels and turns back higher, while price extended above its moving averages and RSI turns flat near 70. In the 4 hours chart a mild positive tone is present, with immediate resistance now at 102.35, in route to 102.80 strong static resistance area.
Support levels: 101.95 101.60 101.20
Resistance levels: 102.35 102.80 103.10
AUD/USD Current price: 0.9385
View Live Chart for the AUD/USD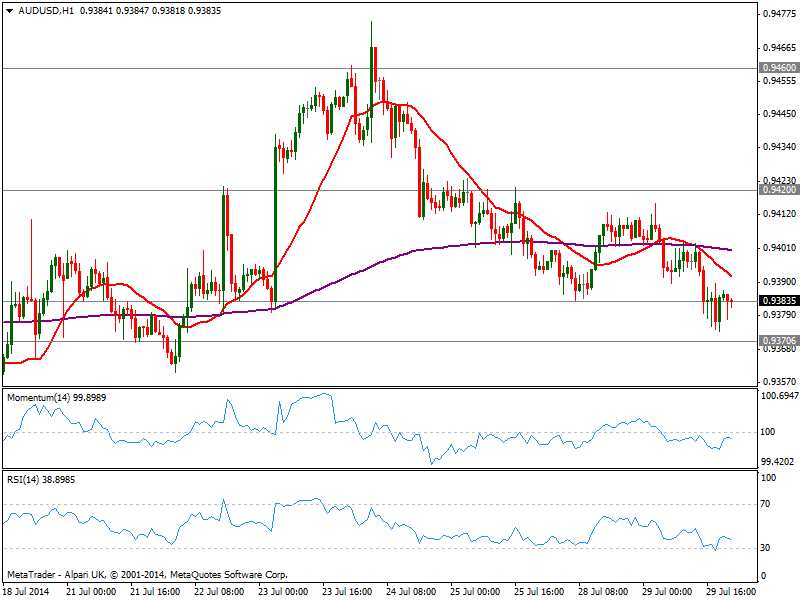
AUD/USD shown little progress over the last 24 hours, approaching to the base of its latest range at 0.9370 immediate support. The pair maintains a bearish tone in the short term, with price developing below its 20 SMA and indicators turning south below their midlines, while the 4 hours chart shows also a mild bearish tone, with indicators mostly flat below their midlines. A break below mentioned level should lead to a retest of critical midterm support around 0.9330, while if this last gives up, the downward momentum will likely accelerates towards 0.9260 price zone.
Support levels: 0.9370 0.9330 0.9300
Resistance levels: 0.9420 0.9460 0.9500
Recommended Content
Editors’ Picks
EUR/USD clings to gains near 1.0700, awaits key US data

EUR/USD clings to gains near the 1.0700 level in early Europe on Thursday. Renewed US Dollar weakness offsets the risk-off market environment, supporting the pair ahead of the key US GDP and PCE inflation data.
USD/JPY keeps pushing higher, eyes 156.00 ahead of US GDP data

USD/JPY keeps breaking into its highest chart territory since June of 1990 early Thursday, recapturing 155.50 for the first time in 34 years as the Japanese Yen remains vulnerable, despite looming intervention risks. The focus shifts to Thursday's US GDP report and the BoJ decision on Friday.
Gold price lacks firm intraday direction, holds steady above $2,300 ahead of US data

Gold price remains confined in a narrow band for the second straight day on Thursday. Reduced Fed rate cut bets and a positive risk tone cap the upside for the commodity. Traders now await key US macro data before positioning for the near-term trajectory.
Injective price weakness persists despite over 5.9 million INJ tokens burned

Injective price is trading with a bearish bias, stuck in the lower section of the market range. The bearish outlook abounds despite the network's deflationary efforts to pump the price. Coupled with broader market gloom, INJ token’s doomed days may not be over yet.
Meta takes a guidance slide amidst the battle between yields and earnings

Meta's disappointing outlook cast doubt on whether the market's enthusiasm for artificial intelligence. Investors now brace for significant macroeconomic challenges ahead, particularly with the release of first-quarter gross domestic product (GDP) data on Thursday.