EUR/USD Current price: 1.3522
View Live Chart for the EUR/USD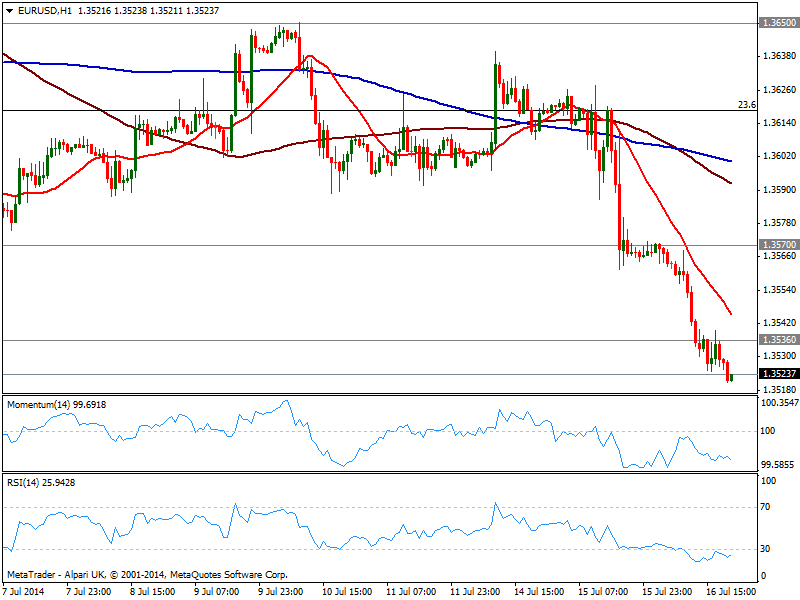
The EUR/USD has extended its decline on Wednesday, breaking through 1.3535 short term support early US session, and holding below it for the rest of it. Despite market sentiment has flipped from Tuesday pessimism to strong gains in European indexes and fresh record highs for DJIA in the US, EUR couldn’t find its foot. From the data front EU Trade Balance missed expectations, albeit US numbers were neither encouraging, with Industrial numbers also missing expectations as well as TICS.
Anyway, and from a technical point of view, the pair is biased lower, with the hourly chart showing momentum heading south, RSI hovering below 30 and 20 SMA with a strong bearish slope above current price. In the 4 hours chart the bearish momentum is even clearer, and despite an upward correction can’t be ruled out, the downside remains favored: below 1.3500 figure, this year low stands as critical support as once below more stops should be triggered. Recoveries on the other hand, had little in the way up to 1.3570 where selling interest awaits.
Support levels: 1.3500 1.3476 1.3440
Resistance levels: 1.3535 1.3570 1.3620
EUR/JPY Current price: 137.56
View Live Chart for the EUR/JPY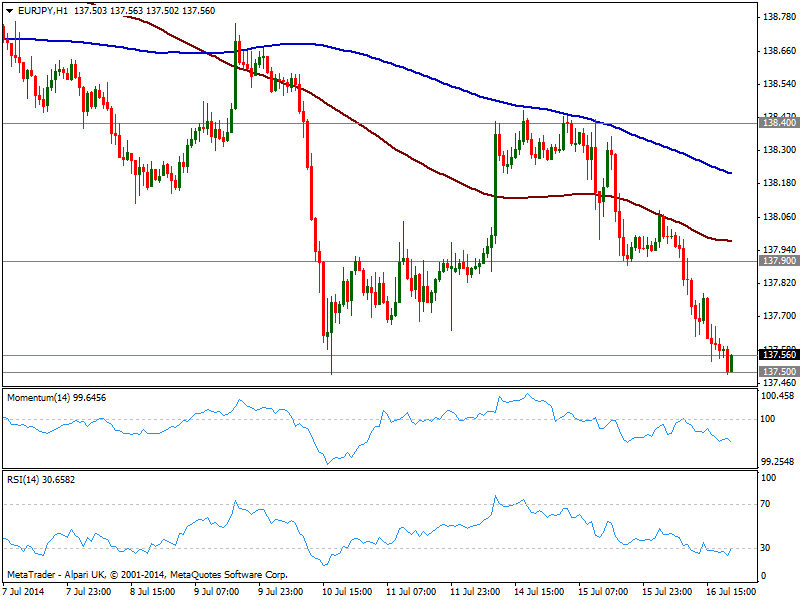
The EUR/JPY remained under pressure, extending its decline to 137.50 static support from where it presented a shy bounce so far on the day. The level is pretty strong as per several daily highs and lows around it, so a break should become significant over the upcoming days, and even be able to weight on EUR/USD. Technically, the hourly chart shows a healthy bearish bias with momentum heading south and price moving away from its 100 SMA currently in the 137.90 price zone offering immediate short term resistance. In the 4 hours chart the pair is also biased lower according to technical readings, pointing for a downward continuation towards strong 136.60 midterm support.
Support levels: 137.50 137.00 136.60
Resistance levels: 137.90 138.40 138.90
GBP/USD Current price: 1.7135
View Live Chart for the GBP/USD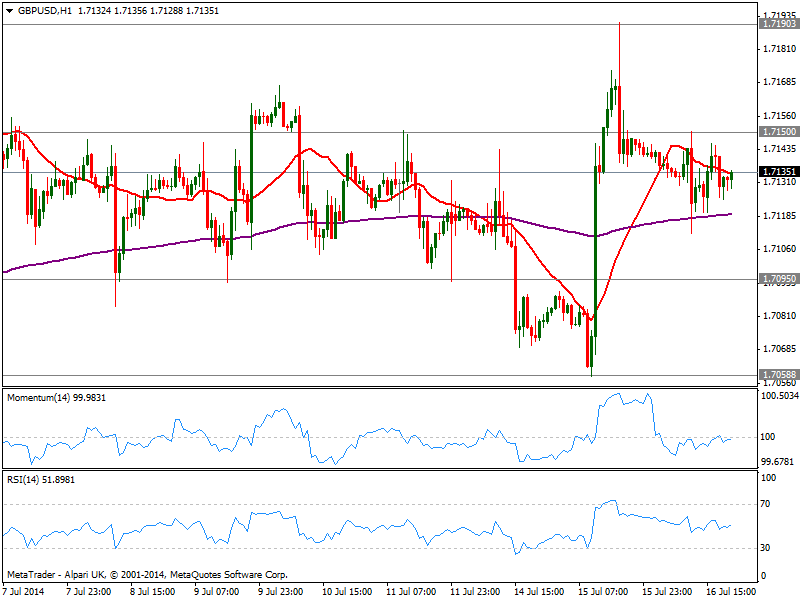
Pound proved once again the charms of being the strongest, having suffered a setback early Europe, when employment UK figures shown wages for past month are the lowest on record, widening the gap between incomes and inflation. Nevertheless, the GBP/USD managed to bounce from a daily low of 1.7112 and spent the rest of the day around current levels. Technical readings are neutral in the hourly chart, reflecting current consolidative stage in the pair, while the same picture stands in the 4 hours chart. Calling for a top is way too early and downward movements continue to be seen as buying opportunities down to 1.7060, 23.6% retracement of the latest bullish run.
Support levels: 1.7120 1.7095 1.7060
Resistance levels: 1.7150 1.7180 1.7220
USD/JPY Current price: 101.72
View Live Chart for the USD/JPY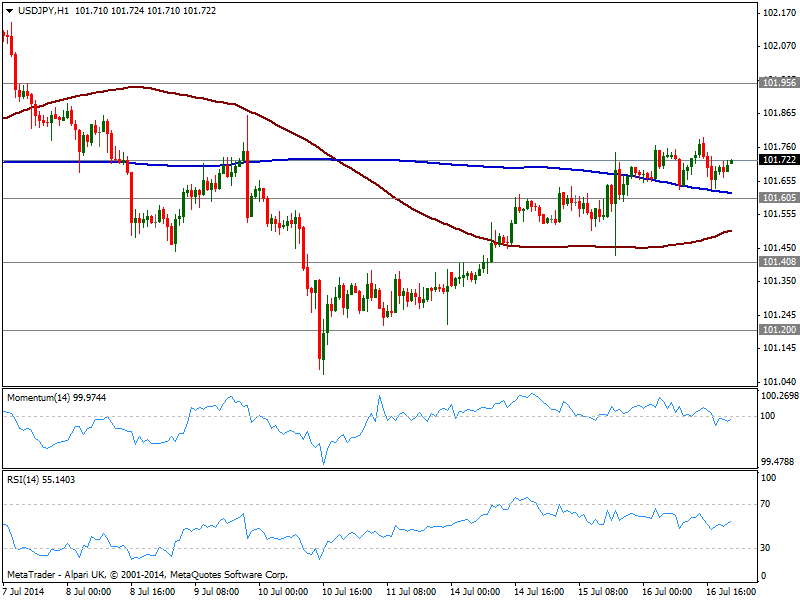
The USD/JPY has traded in a tight range right above the 101.60 level, limited by a daily high of 101.79. The hourly chart shows price above its 200 SMA offering dynamic support around mentioned level, while indicators stand flat around their midlines. In the 4 hours chart a mild positive tone prevails according to technical readings, yet unless a break above 101.95, there’s not much supporting a directional move ahead.
Support levels: 101.60 101.20 100.70
Resistance levels: 101.95 102.35 102.80
AUD/USD Current price: 0.9363
View Live Chart for the AUD/USD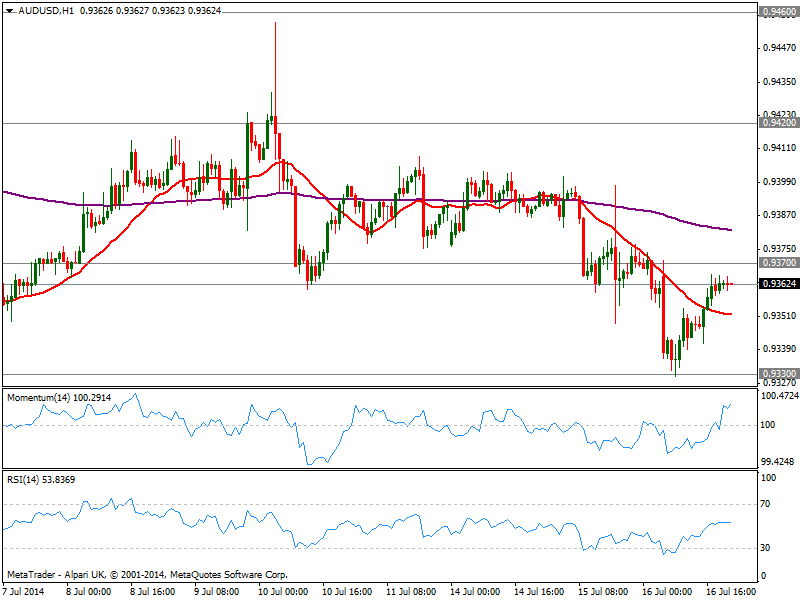
The AUD/USD tested critical midterm support around 0.9330, and managed to bounce some on the back of general positive mood, albeit trades now below 0.9370 immediate short term resistance. The hourly chart shows a mild positive tone with price above a bearish 20 SMA and indicators flat in positive territory, while the 4 hours chart maintains the negative tone albeit showing no current directional strength. For the most the downside is favored although 0.9320/30 has proved strong over these last two months. Stops below it should be large and therefore once triggered, fuel a downward run.
Support levels: 0.9330 0.9300 0.9260
Resistance levels: 0.9370 0.9420 0.9460
Recommended Content
Editors’ Picks
EUR/USD regains traction, recovers above 1.0700

EUR/USD regained its traction and turned positive on the day above 1.0700 in the American session. The US Dollar struggles to preserve its strength after the data from the US showed that the economy grew at a softer pace than expected in Q1.
GBP/USD returns to 1.2500 area in volatile session

GBP/USD reversed its direction and recovered to 1.2500 after falling to the 1.2450 area earlier in the day. Although markets remain risk-averse, the US Dollar struggles to find demand following the disappointing GDP data.
Gold climbs above $2,340 following earlier drop

Gold fell below $2,320 in the early American session as US yields shot higher after the data showed a significant increase in the US GDP price deflator in Q1. With safe-haven flows dominating the markets, however, XAU/USD reversed its direction and rose above $2,340.
XRP extends its decline, crypto experts comment on Ripple stablecoin and benefits for XRP Ledger

Ripple extends decline to $0.52 on Thursday, wipes out weekly gains. Crypto expert asks Ripple CTO how the stablecoin will benefit the XRP Ledger and native token XRP.
After the US close, it’s the Tokyo CPI

After the US close, it’s the Tokyo CPI, a reliable indicator of the national number and then the BoJ policy announcement. Tokyo CPI ex food and energy in Japan was a rise to 2.90% in March from 2.50%.