EUR/USD Current price: 1.3604
View Live Chart for the EUR/USD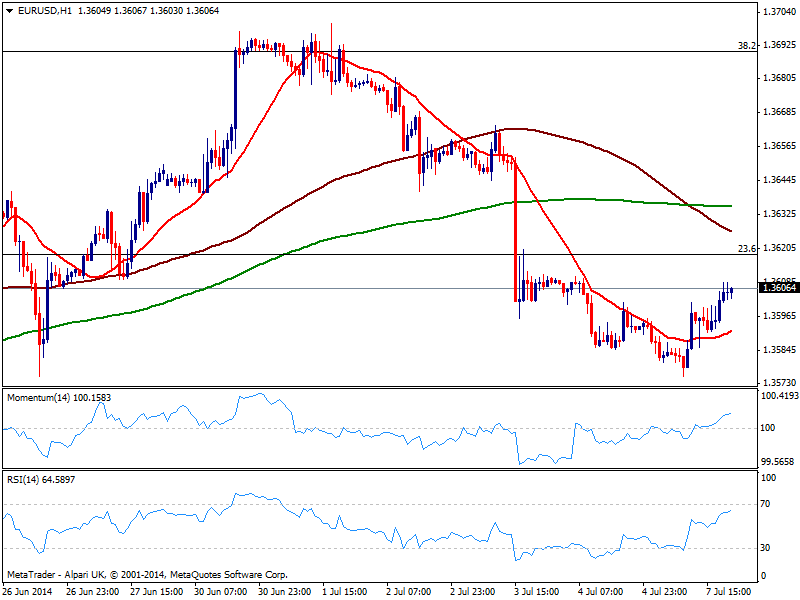
In a day with no macro releases in Europe, nor the US, the EUR/USD managed to edge up with some limited gains after posting a daily low of 1.3575, entering Asian session right above the 1.3600 figure. Nevertheless, the pair has seen little action all through this Monday, and remains capped below 1.3620, 23.6% retracement of the 1.40/1.35 slide and immediate short term resistance. The hourly chart shows a mild positive tone as per indicators heading higher above their midlines and price standing above its 20 SMA, albeit larger moving averages are still well above current price. In the 4 hours chart, indicators advance but hold well below their midlines, while moving averages converge a few pips above current price, reflecting the clear lack of directional trend. Some advances above mentioned resistance may see price extending its recovery up to 1.3675, 61.8% retracement of this year rally, where buyers will likely halt any other attempt of advancing. To the downside, a break below 1.3570 is required to trigger some stops and fuel a bearish run towards 1.3500/30 price zone.
Support levels: 1.3570 1.3530 1.3500
Resistance levels: 1.3620 1.3675 1.3700
EUR/JPY Current price: 138.76
View Live Chart for the EUR/JPY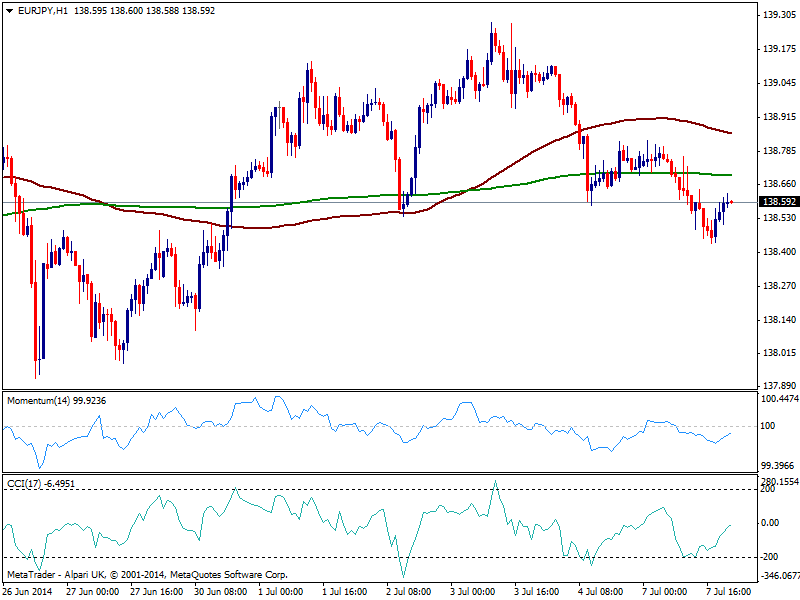
Stocks suffered across the world this Monday, helping yen advance against most rivals and dragging EUR/JPY down to 138.43 before some limited bounce. Nevertheless, the technical picture remains bearish for the pair, after posting a lower low daily basis adding to the repeated failure to retake 139.00 last week. The hourly chart shows price below 100 and 200 SMA while indicators aim higher below their midlines. In the 4 hours chart however, momentum maintains a strong bearish slope while moving averages cap the upside, still supporting a quick test of 137.90 strong static support before a clearer picture sees the light.
Support levels: 138.40 137.90 137.40
Resistance levels: 138.90 139.35 139.80
GBP/USD Current price: 1.7128
View Live Chart for the GBP/USD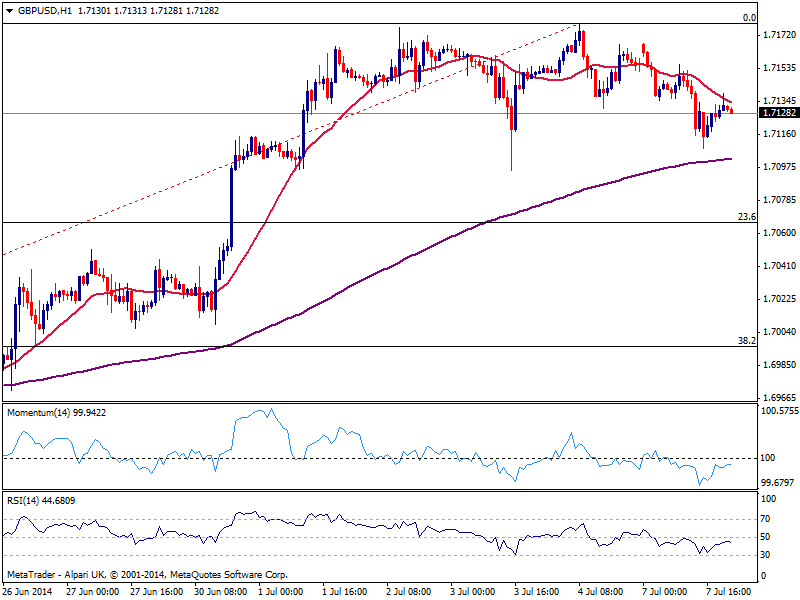
The GBP/USD retraced further from its year high, down to 1.7107 on the day, but maintaining the short term negative tone according to the hourly chart: 20 SMA presents a clear bearish slope and acts as dynamic resistance, capping the upside now around 1.7130, while indicators turn lower below their midlines. In the 4 hours chart the technical picture is quite alike with 20 SMA losing its upward slope, now flat above current price, and indicators entering negative territory. The movement seems just corrective, with 1.7060 as key level to watch during the upcoming hours, as per being the 23.6% retracement of the latest bullish run: a break below should signal a downward continuation in the pair while further upward momentum will surge only on a break above 1.7180 year high.
Support levels: 1.7095 1.7060 1.7020
Resistance levels: 1.7130 1.7180 1.7220
USD/JPY Current price: 101.84
View Live Chart for the USD/JPY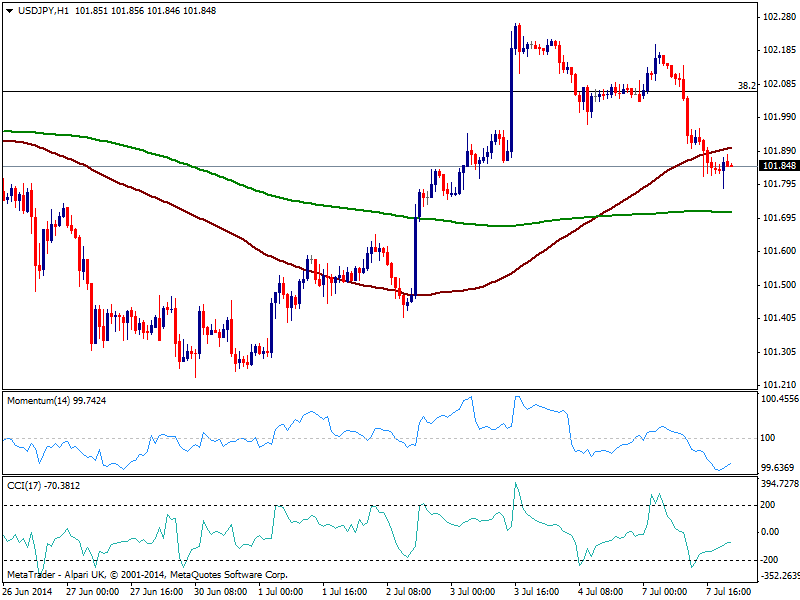
The USD/JPY erased all of its recent gains and trades now heavily near 101.60 static support. The hourly chart shows indicators exhausted to the downside, albeit price is unable to follow the upward correction, which keeps the pressure south. 100 SMA acts now as immediate resistance in the 101.95 price zone, while 200 one converges with mentioned static support of 101.60. In the 4 hours chart indicators present a strong bearish momentum as they cross their midlines to the downside, supporting the shorter term view.
Support levels: 101.60 101.20 100.70
Resistance levels: 101.95 102.35 102.80
AUD/USD Current price: 0.9371
View Live Chart for the AUD/USD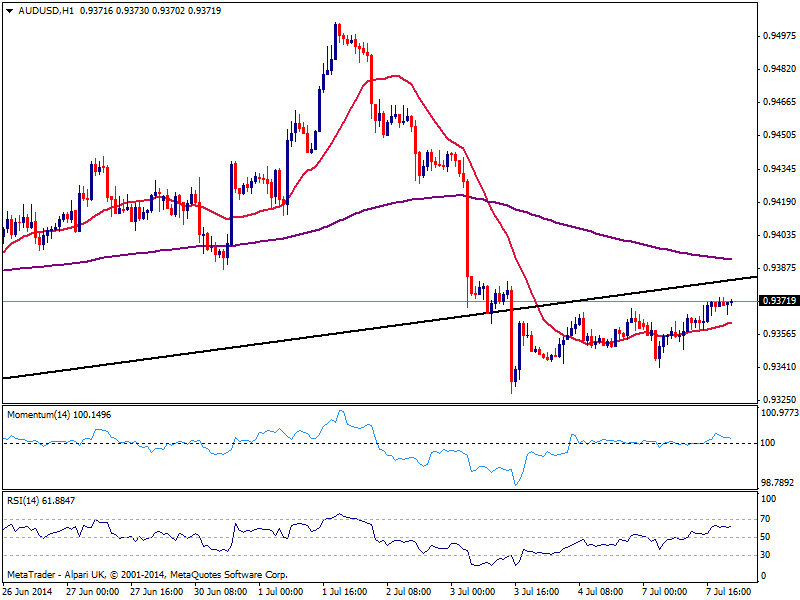
The AUD/USD managed to regain some ground, pressuring the static resistance area around 0.9380 for most of the past session, but overall neutral in the short term: the hourly chart shows price holding above a flat 20 SMA while indicators rest above their midlines, showing no actual directional strength. In the 4 hours chart price is being unable to overcome a still bearish 20 SMA while indicators recovered from oversold levels and approach their midlines. Further advances above 0.9420 are required to deny the bearish tone and see a recovery up to 0.9460, while a break below 0.9330 will see the pair resuming its bearish tone.
Support levels: 0.9330 0.9300 0.9260
Resistance levels: 0.9380 0.9420 0.9460
Recommended Content
Editors’ Picks
EUR/USD holds gains above 1.0700, as key US data loom

EUR/USD holds gains above 1.0700 in the European session on Thursday. Renewed US Dollar weakness offsets the risk-off market environment, supporting the pair ahead of the key US GDP and PCE inflation data.
GBP/USD extends recovery above 1.2500, awaits US GDP data

GBP/USD is catching a fresh bid wave, rising above 1.2500 in European trading on Thursday. The US Dollar resumes its corrective downside, as traders resort to repositioning ahead of the high-impact US advance GDP data for the first quarter.
Gold price edges higher amid weaker USD and softer risk tone, focus remains on US GDP

Gold price (XAU/USD) attracts some dip-buying in the vicinity of the $2,300 mark on Thursday and for now, seems to have snapped a three-day losing streak, though the upside potential seems limited.
XRP extends its decline, crypto experts comment on Ripple stablecoin and benefits for XRP Ledger

Ripple extends decline to $0.52 on Thursday, wipes out weekly gains. Crypto expert asks Ripple CTO how the stablecoin will benefit the XRP Ledger and native token XRP.
US Q1 GDP Preview: Economic growth set to remain firm in, albeit easing from Q4

The United States Gross Domestic Product (GDP) is seen expanding at an annualized rate of 2.5% in Q1. The current resilience of the US economy bolsters the case for a soft landing.