EUR/USD Current price: 1.3595
View Live Chart for the EUR/USD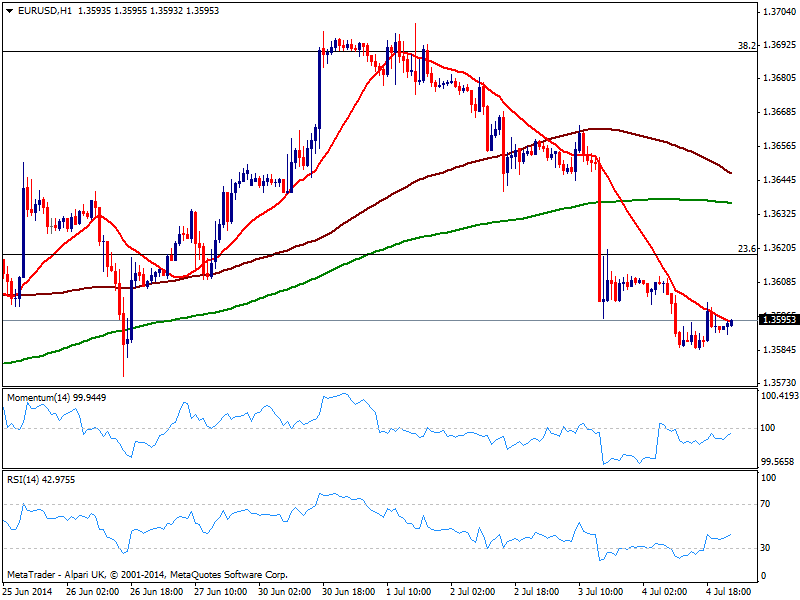
Market starts the week pretty much unchanged from early Friday close, with the EUR/USD trading below the 1.3600 figure, having shown little progress in a quite flat holiday. The pair extended NFP slide to 1.3585, finding some support on the strong static support area, albeit unable to regain much ground. In the short term, the hourly chart shows price aiming to cross above its 20 SMA while indicators also advance some but hold below their midlines. In the 4 hours chart indicators bounced some oversold levels but remain in negative territory as price develops below moving averages. Steady gains above the 1.3600 figure may favor a recovery up to 1.3640/50 strong static resistance area, yet risk remains to the downside, moreover on a break below 1.3575 price zone.
Support levels: 1.3575 1.3530 1.3500
Resistance levels: 1.3645 1.3675 1.3700
EUR/JPY Current price: 138.76
View Live Chart for the EUR/JPY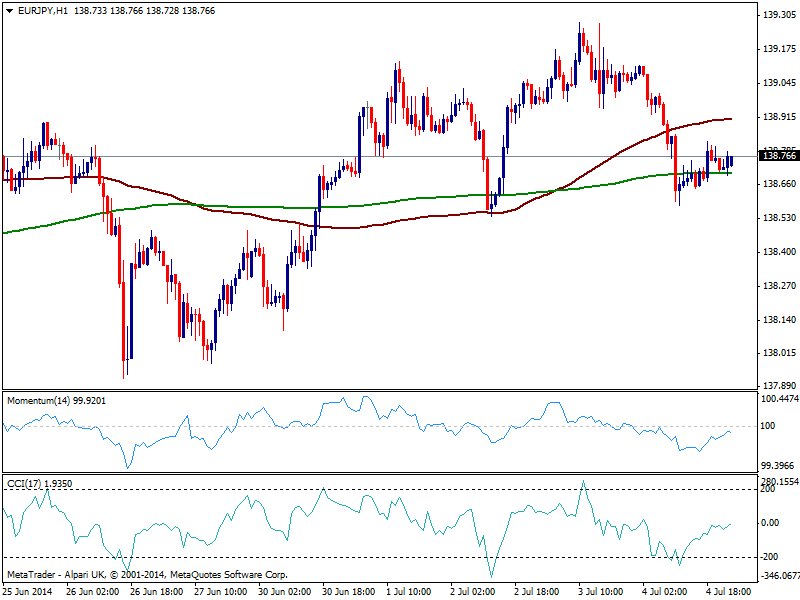
Back below 139.00, the EUR/JPY is clearly being weighed by EUR self weakness, with losses so far limited in this particular cross by still rising stocks all over the world: American indexes closed last week at record highs, while local Nikkei flirts with the strong resistance area around 15480. As for the EUR/JPY, the hourly chart shows indicators losing upward potential below their midlines and price below its 100 SMA currently around 138.90, while 200 one provides some short term support around 138.55. In the 4 hours chart the pair is biased lower as per indicators turning south still in negative territory, with some price acceleration below mentioned support exposing 137.90 in the short term.
Support levels: 138.55 137.90 137.40
Resistance levels: 138.90 139.35 139.80
GBP/USD Current price: 1.7163
View Live Chart for the GBP/USD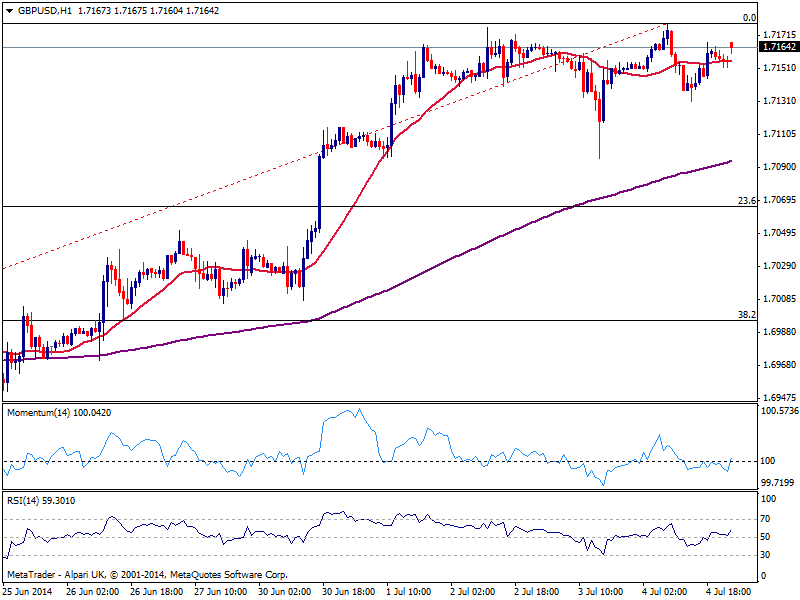
Pound holds near its highs against the greenback, and even gapped higher as a new week starts: despite the hourly chart maintains a neutral tone, the upside remains favored. In the hourly chart indicators aim higher above their midlines as price stands above a flat 20 SMA, while the 4 hours chart shows a quite similar picture, bullish but lacking strength at the moment. Downward corrections are likely, yet buyers continue to surge on dips, with 1.7060 still attracting buyers: only below this last sellers may gain some control, while fresh high above 1.7180 immediate resistance, expose the 1.7250 price zone.
Support levels: 1.7130 1.7095 1.7060
Resistance levels: 1.7180 1.7220 1.7250
USD/JPY Current price: 102.05
View Live Chart for the USD/JPY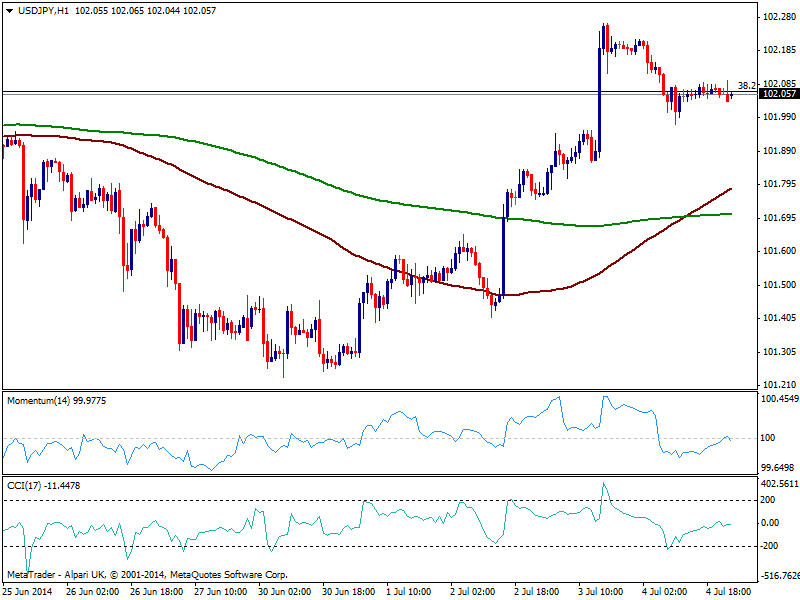
The USD/JPY erased half its Thursday’s gains on Friday, again suffering around the 102.00 price zone, after failing to overcome the strong static resistance area around 102.30/40 the hourly chart shows 100 SMA crossing to the upside 200 one both well below current price, but indicators flat around their midlines, while in the 4 hours chart indicators turned south and approach their midlines. Short term, risk to the downside increases with a downward extension below 101.60, exposing the pair again to a retest of the 100.70 price zone.
Support levels: 101.90 101.60 101.20
Resistance levels: 102.35 102.80 103.10
AUD/USD Current price: 0.9360
View Live Chart for the AUD/USD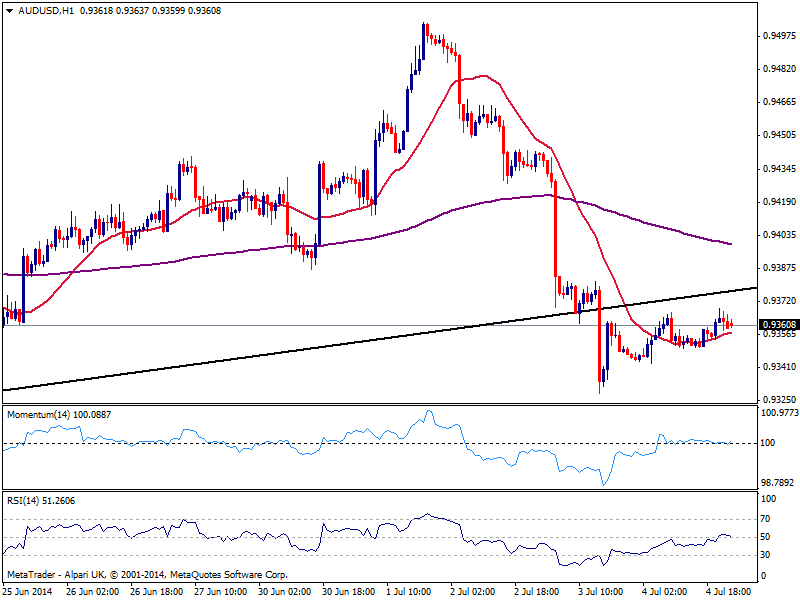
Australian dollar corrected some higher against the greenback, finding now resistance on former support in the 0.9380 price zone. Technical readings in the short term stand flat after breaking below the 0.9400 figure, giving little clues on upcoming moves. Last week low converges with a strong static support zone around 0.9320/30 and as long as above risk to the downside remains limited. Nevertheless a price acceleration below the level should signal a continuation down to 0.9260 strong midterm support. If somehow price regains the 0.9400 level, the downside will be denied with chances of a retest of the 0.9460 price zone.
Support levels: 0.9330 0.9300 0.9260
Resistance levels: 0.9380 0.9420 0.9460
Recommended Content
Editors’ Picks
EUR/USD retreats toward 1.0650 after PMI-inspired rebound

EUR/USD loses traction and retreats to the 1.0650 area after rising toward 1.0700 with the immediate reaction to the upbeat PMI reports from the Eurozone and Germany. The cautious market stance helps the USD hold its ground ahead of US PMI data.
GBP/USD fluctuates near 1.2350 after UK PMIs

GBP/USD clings to small daily gains near 1.2350 in the European session on Tuesday. The data from the UK showed that the private sector continued to grow at an accelerating pace in April, helping Pound Sterling stay resilient against its rivals.
Gold flirts with $2,300 amid receding safe-haven demand

Gold (XAU/USD) remains under heavy selling pressure for the second straight day on Tuesday and languishes near its lowest level in over two weeks, around the $2,300 mark in the European session. Eyes on US PMI data.
Here’s why Ondo price hit new ATH amid bearish market outlook Premium

Ondo price shows no signs of slowing down after setting up an all-time high (ATH) at $1.05 on March 31. This development is likely to be followed by a correction and ATH but not necessarily in that order.
US S&P Global PMIs Preview: Economic expansion set to keep momentum in April

S&P Global Manufacturing PMI and Services PMI are both expected to come in at 52 in April’s flash estimate, highlighting an ongoing expansion in the private sector’s economic activity.