EUR/USD Current price: 1.3655
View Live Chart for the EUR/USD
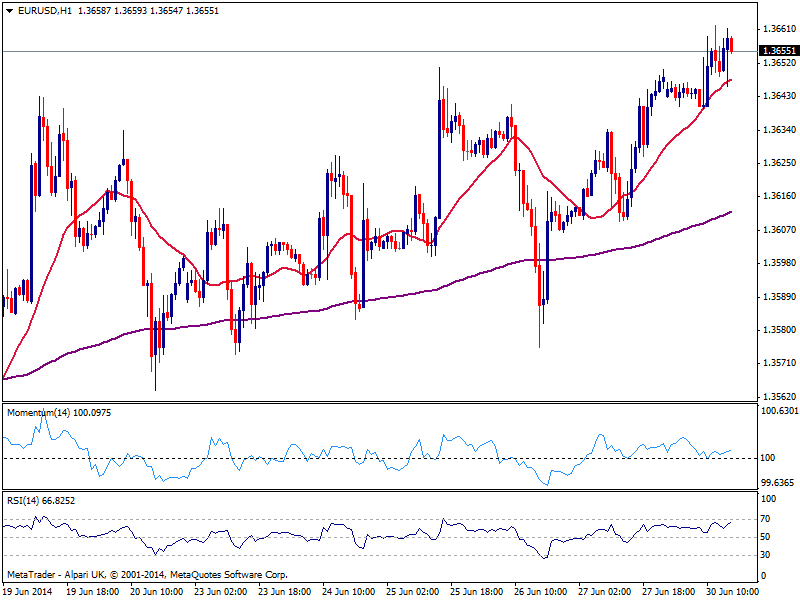
The dollar stands around its monthly low particularly against its European, rivals, with the EUR/USD trading around 1.3660 and maintaining a positive tone according to technical studies, as the hourly chart shows price finding support in a bullish 20 SMA and indicators heading higher in positive territory. In the 4 hours chart the technical picture is also bullish, with price approaching 1.3680 strong Fibonacci resistance. A break above it should trigger some stops and therefore favor some further intraday gains, albeit limited ahead of key data later this week.
Support levels: 1.3645 1.3610 1.3575
Resistance levels: 1.3680 1.3720 1.3750
GBP/USD Current price: 1.7050
View Live Chart for the GBP/USD
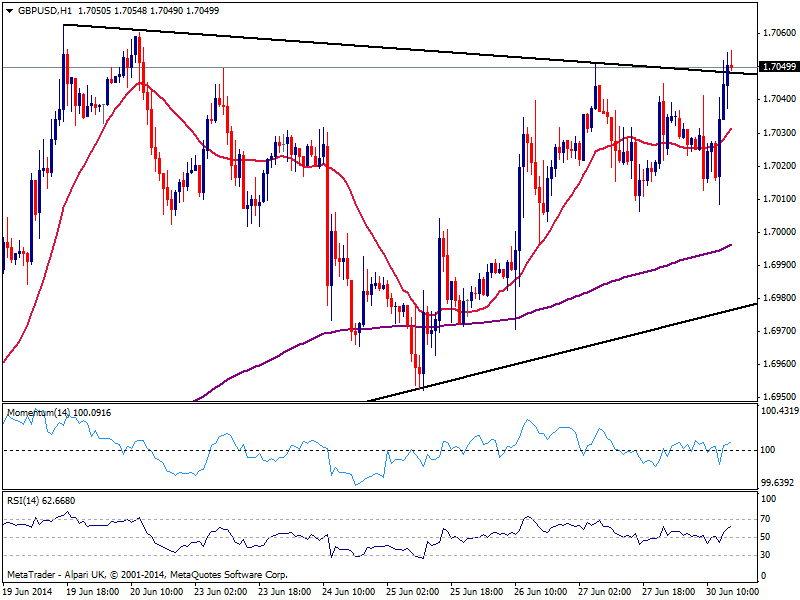
The GBP/USD accelerates higher early US session with the pair advancing above the roof of the short term symmetrical triangle that contained price over the last few days. Nevertheless, the pair is capped below this year high of 1.7060 immediate resistance, with the hourly chart showing a strong upward momentum coming from technical readings both in 1 and 4 hours charts: further upward momentum should see price approaching the 1.7100 figure, opening doors for a test of 1.7250 strong midterm resistance zone.
Support levels: 1.7020 1.69850 1.6950
Resistance levels: 1.7060 1.7095 1.7135
USD/JPY Current price: 101.36
View Live Chart for the USD/JPY
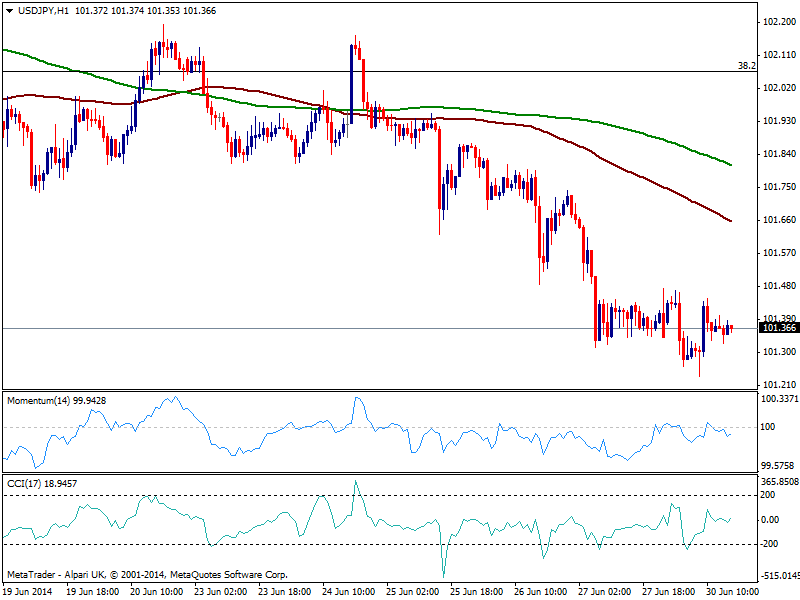
Lower in range, the USD/JPY has posted so far a daily low of 101.23 trading within a tight 20 pips range since the day started. The hourly chart shows price developing its moving averages and indicators holding in negative territory, while the 4 hours chart shows the picture is also bearish, albeit indicators lack directional strength: further slides below mentioned support should lead to a retest of this year lows around 100.70 while below this last the bearish momentum will likely accelerate and drive price further down towards 100.00.
Support levels: 101.20 100.70 100.35
Resistance levels: 101.60 102.00 102.35
AUD/USD Current price: 0.9396
View Live Chart for the AUD/USD
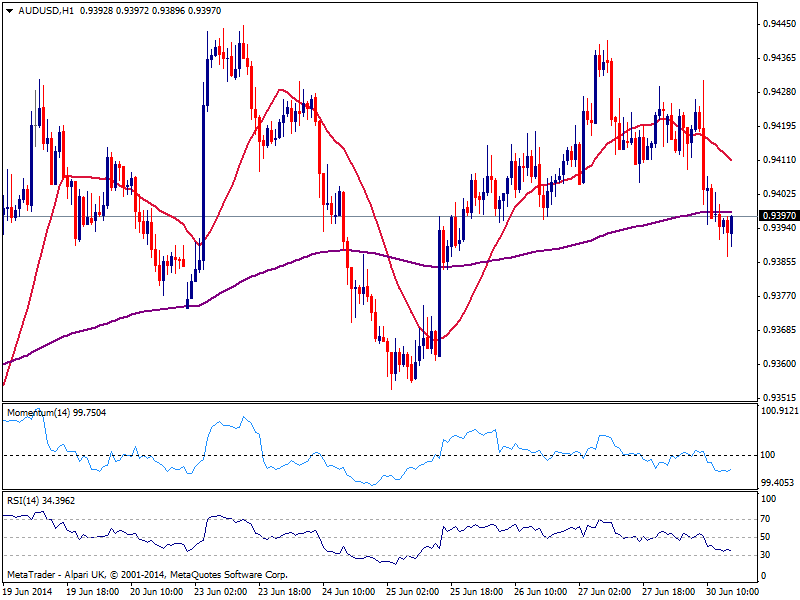
Aussie gave up some ground early weekly opening, easing down to 0.9387 against the greenback. The hourly chart shows price bouncing from mentioned low but still below 0.94, while indicators maintain a bearish bias and 20 SMA caps the upside now around 0.9410. The 4 hours chart indicators turned south and crossed their midlines as price develops below its 20 SMA, adding to a possible bearish continuation, to be confirmed on a break below 0.9370.
Support levels: 0.9370 0.9330 0.9290
Resistance levels: 0.9410 0.9460 0.9500
Recommended Content
Editors’ Picks
AUD/USD remained bid above 0.6500

AUD/USD extended further its bullish performance, advancing for the fourth session in a row on Thursday, although a sustainable breakout of the key 200-day SMA at 0.6526 still remain elusive.
EUR/USD faces a minor resistance near at 1.0750

EUR/USD quickly left behind Wednesday’s small downtick and resumed its uptrend north of 1.0700 the figure, always on the back of the persistent sell-off in the US Dollar ahead of key PCE data on Friday.
Gold holds around $2,330 after dismal US data

Gold fell below $2,320 in the early American session as US yields shot higher after the data showed a significant increase in the US GDP price deflator in Q1. With safe-haven flows dominating the markets, however, XAU/USD reversed its direction and rose above $2,340.
Bitcoin price continues to get rejected from $65K resistance as SEC delays decision on spot BTC ETF options

Bitcoin (BTC) price has markets in disarray, provoking a broader market crash as it slumped to the $62,000 range on Thursday. Meanwhile, reverberations from spot BTC exchange-traded funds (ETFs) continue to influence the market.
US economy: slower growth with stronger inflation

The dollar strengthened, and stocks fell after statistical data from the US. The focus was on the preliminary estimate of GDP for the first quarter. Annualised quarterly growth came in at just 1.6%, down from the 2.5% and 3.4% previously forecast.