EUR/USD Current price: 1.3866
View Live Chart for the EUR/USD
Market is on its toes this Friday, with dollar firmer after the release of better than expected PPI figures and increasing risk aversion due to escalating Russian/Ukraine conflict. Stocks however are in the eye of the storm as shares all over the world are seeing another day of wild selloff, with US futures trading in deep red and S&P breaking through a critical support level ahead of the opening.
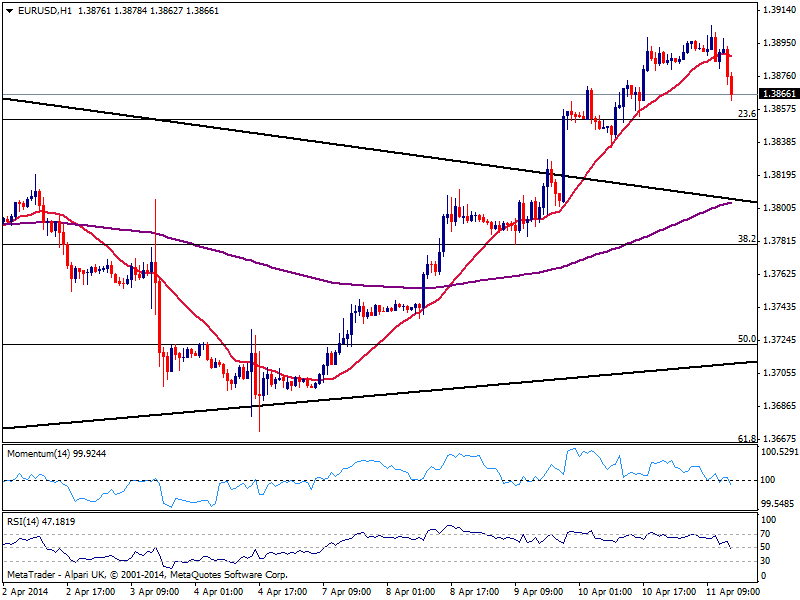
The EUR/USD feels the heat and trades slightly lower intraday after posting a high of 1.3905, with the hourly chart showing an increasing short term bearish potential: price accelerates below its 20 SMA as indicator turn bearish breaking through their midlines. In the 4 hours chart indicators hold in overbought territory, while 20 SMA maintains a strong upward momentum currently around 1.3830 offering short term support: a break below this last should see price extending its downward correction towards 1.3780 strong static support zone.
Support levels: 1.3850 1.3825 1.3780
Resistance levels: 1.3920 1.3965 1.4000
GBP/USD Current price: 1.6726
View Live Chart for the GBP/USD
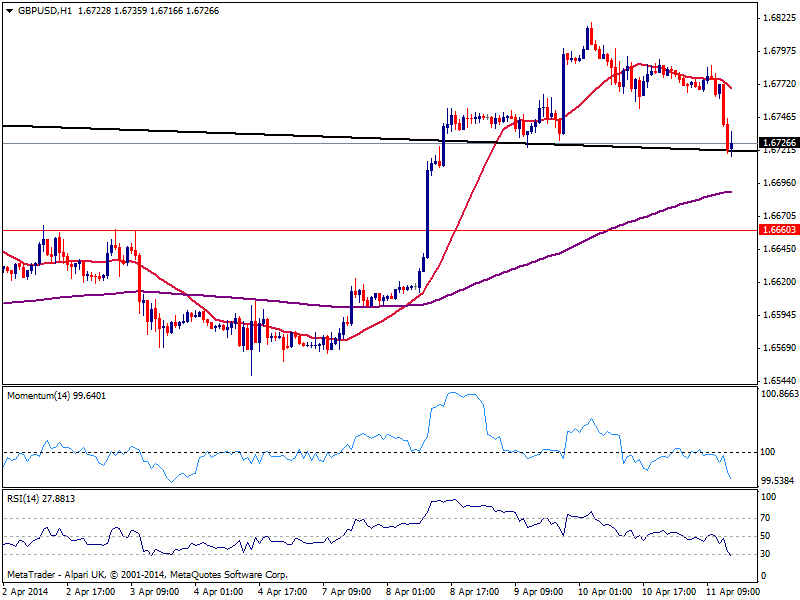
Pound capitulated finally and trades lower against the greenback, having found short term buyers around 1.6720 for now, yet maintaining a bearish tone according to the hourly chart, as 20 SMA turns lower well above current price while indicators head strongly south in negative territory. In the 4 hours chart indicators had corrected the extreme overbought readings seen during the past updates, and approach their midlines losing bearish potential, while 20 SMA continues heading higher albeit above current price. The picture remains slightly bearish intraday, with a break below the daily low favoring an extension of the bearish correction down to 1.6660.
Support levels: 1.6720 1.6660 1.6625
Resistance levels: 1.6755 1.6820 1.6860
USD/JPY Current price: 101.50
View Live Chart for the USD/JPY
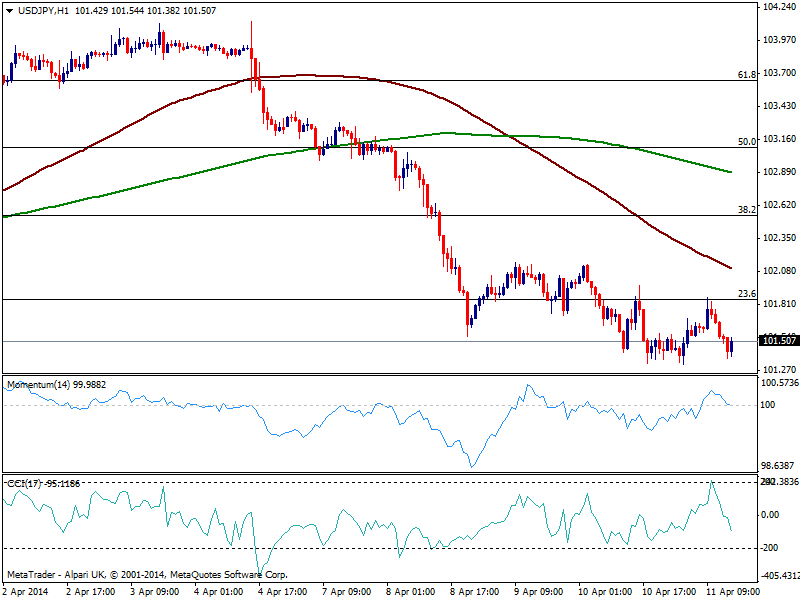
Yen maintains its dominant strength against the greenback, trading near the lows set in the 101.30 price zone. The hourly chart presents a clear bearish tone, with price being capped by a Fibonacci retracement around 101.90, 100 SMA accelerating lower and indicators heading south in negative territory. In the 4 hours chart the technical picture is also bearish, with momentum retracing from its midline after correcting oversold readings. A break below 101.20 however, is required to confirm a bearish acceleration eyeing 100.70 next.
Support levels: 101.20 100.70 100.30
Resistance levels: 101.90 102.35 102.60
AUD/USD Current price: 0.9391
View Live Chart for the AUD/USD
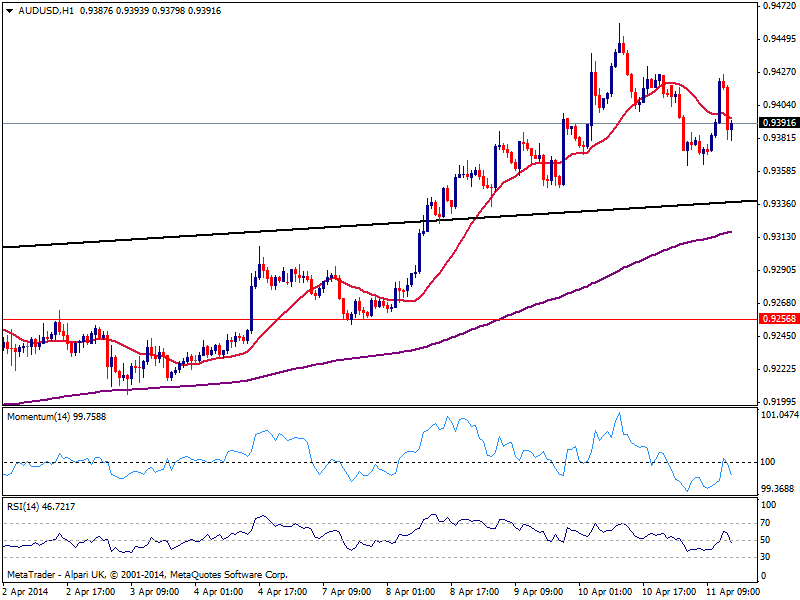
The AUD/USD traded pretty steadied finding intraday support around 0.9360, and presenting slightly bearish tone ahead of the US opening: price is being capped by a bearish 20 SMA while indicators head lower around their midlines. In the 4 hours chart however, technical readings maintain a strong positive tone with price bouncing from a bullish 20 SMA and indicators bouncing from their midlines. Nevertheless, bulls remain in control unless price manages to break below 0.9320 strong static support zone.
Support levels: 0.9360 0.9320 0.9290
Resistance levels: 0.9410 0.9445 0.9485
Recommended Content
Editors’ Picks
US economy grows at an annual rate of 1.6% in Q1 – LIVE

The US' real GDP expanded at an annual rate of 1.6% in the first quarter, the US Bureau of Economic Analysis' first estimate showed on Thursday. This reading came in worse than the market expectation for a growth of 2.5%.
EUR/USD retreats to 1.0700 after US GDP data

EUR/USD came under modest bearish pressure and retreated to the 1.0700 area. Although the US data showed that the economy grew at a softer pace than expected in Q1, strong inflation-related details provided a boost to the USD.
GBP/USD declines below 1.2500 with first reaction to US data

GBP/USD declined below 1.2500 and erased a portion of its daily gains with the immediate reaction to the US GDP report. The US economy expanded at a softer pace than expected in Q1 but the price deflator jumped to 3.4% from 1.8%.
Gold falls below $2,330 as US yields push higher

Gold came under modest bearish pressure and declined below $2,330. The benchmark 10-year US Treasury bond yield is up more than 1% on the day after US GDP report, making it difficult for XAU/USD to extend its daily recovery.
XRP extends its decline, crypto experts comment on Ripple stablecoin and benefits for XRP Ledger

Ripple extends decline to $0.52 on Thursday, wipes out weekly gains. Crypto expert asks Ripple CTO how the stablecoin will benefit the XRP Ledger and native token XRP.


