EUR/USD Current price: 1.3184
View Live Chart for the EUR/USD
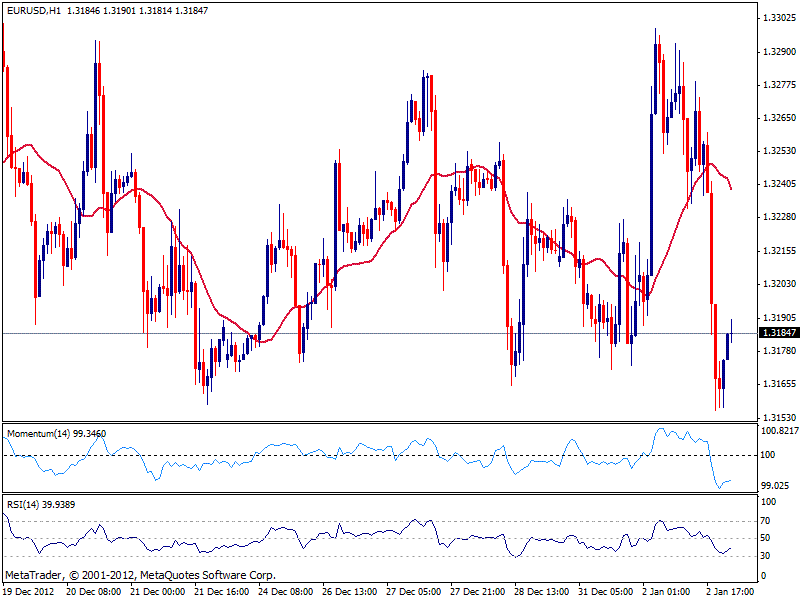
So at the last minute possible, the US lawmakers avoided the fiscal cliff. Markets opened after the long holidays in full risk-appetite mode, driving dollar strongly down across the board, as stocks soared along with commodities: S&P and the DJIA closed with over 2% gains. The EUR/USD halted however a few pips shy of 1.3300, as market players had second toughs following news the US may be actually downgraded after the band-aid solution voted by Congress, and fell back to a daily low of 1.3155, entering Asian session looking heavy in the hourly chart, with price near the bottom of recent range and indicators in negative territory. The 1.3140/50 area comes as a strong static support and a break below, will likely open doors for further slides in the common currency, although if market sentiment remains strong, a recovery above 1.3200/10 may see the pair reaching again 1.3250 price zone.
Support levels: 1.3140 1.3100 1.3070
Resistance levels: 1.3210 1.3250 1.3290
GBP/USD Current price: 1.6254
View Live Chart for the GBP/USD (select the currency)
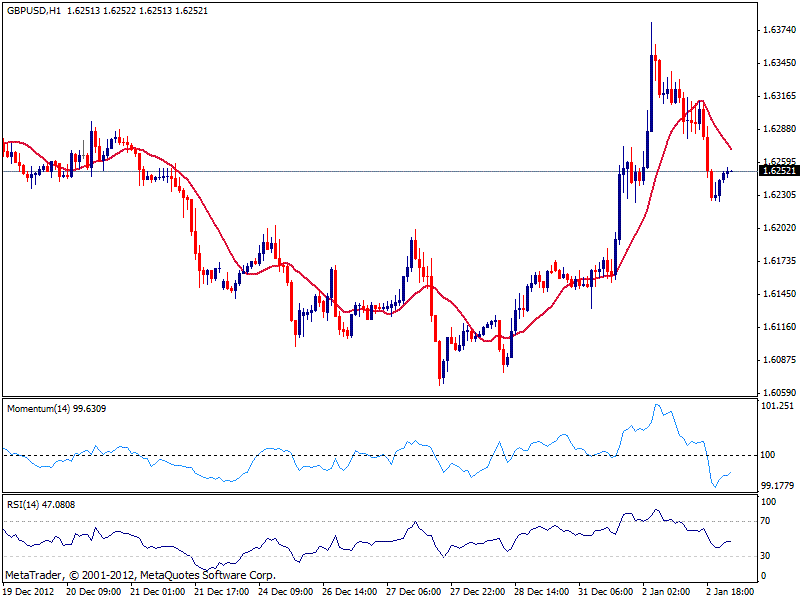
The GBP/USD extended to 1.6381 today, overcoming 2012 high yet quickly retracing its gains, finding buyers in the 1.6220 price zone. The hourly chart shows price aiming to recover and approaching a bearish 20 SMA as indicators also aim higher still in negative territory. In the 4 hours chart however, technical readings hold a stronger bullish tone after price bounced higher from a bullish 20 SMA while indicators corrected extreme overbought readings and turned back north: the upside remains favored as long as price stands above 1.6175, with scope for a retest of mentioned high.
Support levels: 1.6220 1.6175 1.6140
Resistance levels: 1.6270 1.6310 1.6380
USD/JPY Current price: 87.33
View Live Chart for the USD/JPY (select the currency)
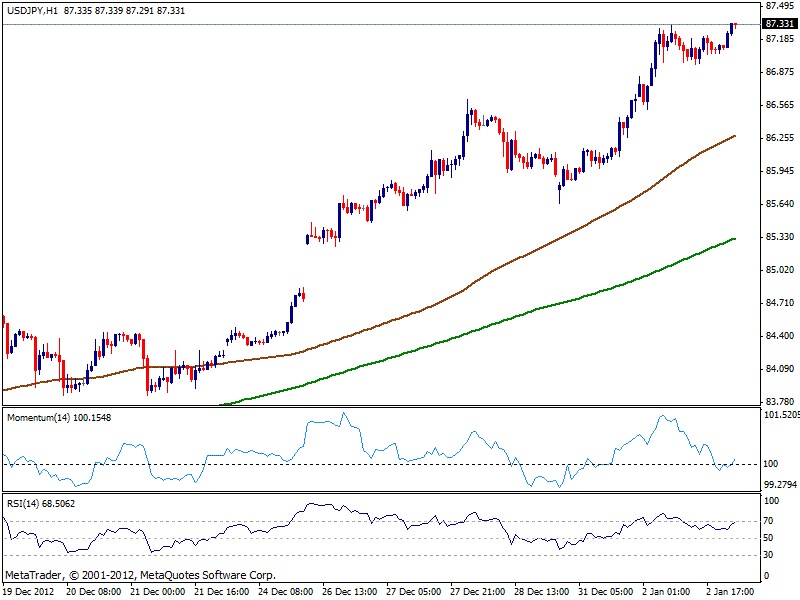
The USD/JPY never turned back continuing with the bullish trend set early November to fresh highs at current levels, not seen since July 2010. The hourly chart shows indicators aiming slightly higher yet in neutral territory, while in bigger time frames the upward momentum is quite stronger, supporting further gains in the pair. Daily chart shows indicators in overbought territory but still heading higher, while 100 SMA overcomes 200 one first time since late August 2012: still expecting corrective movements to be limited ahead of a continued advance towards 90.00.
Support levels: 87.07 86.60 86.25
Resistance levels: 87.60 87.95 88.40
AUD/USD: Current price: 1.0497
View Live Chart for the AUD/USD (select the currency)
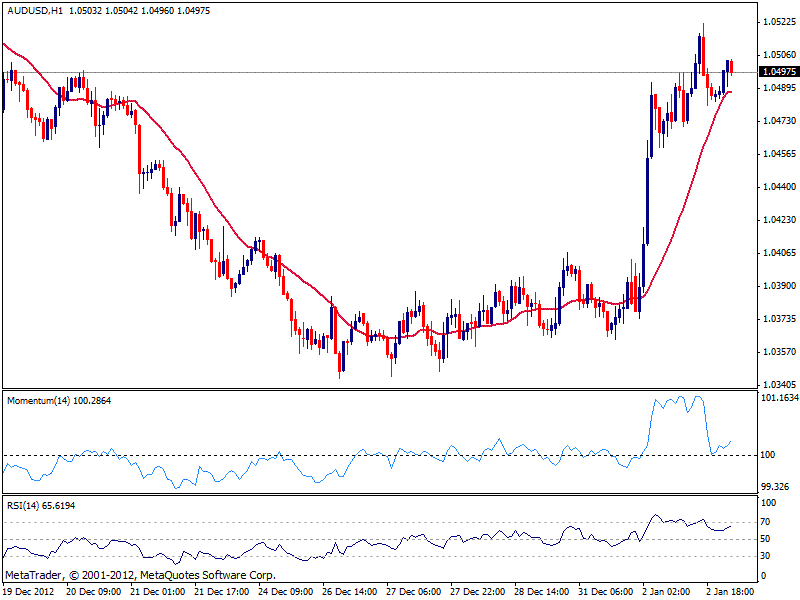
Despite the impressive intraday rally, the AUD/USD was unable to sustain gains beyond the 1.0500 level, consolidating around it as Asia comes to play. The short term technical outlook however, remains bullish for the pair according to the hourly chart, as indicators bounced from their midlines and price from 20 SMA, currently around 1.0485 acting as immediate support. The 4 hours chart shows indicators in overbought territory still heading higher, although price needs to settle above 1.0520 area to confirm further gains with 1.0600 now at sight.
Support levels: 1.0485 1.0440 1.0400
Resistance levels: 1.0520 1.0550 1.0600
Recommended Content
Editors’ Picks
EUR/USD clings to daily gains above 1.0650

EUR/USD gained traction and turned positive on the day above 1.0650. The improvement seen in risk mood following the earlier flight to safety weighs on the US Dollar ahead of the weekend and helps the pair push higher.
GBP/USD recovers toward 1.2450 after UK Retail Sales data

GBP/USD reversed its direction and advanced to the 1.2450 area after touching a fresh multi-month low below 1.2400 in the Asian session. The positive shift seen in risk mood on easing fears over a deepening Iran-Israel conflict supports the pair.
Gold holds steady at around $2,380 following earlier spike

Gold stabilized near $2,380 after spiking above $2,400 with the immediate reaction to reports of Israel striking Iran. Meanwhile, the pullback seen in the US Treasury bond yields helps XAU/USD hold its ground.
Bitcoin Weekly Forecast: BTC post-halving rally could be partially priced in Premium

Bitcoin price shows no signs of directional bias while it holds above $60,000. The fourth BTC halving is partially priced in, according to Deutsche Bank’s research.
Week ahead – US GDP and BoJ decision on top of next week’s agenda

US GDP, core PCE and PMIs the next tests for the Dollar. Investors await BoJ for guidance about next rate hike. EU and UK PMIs, as well as Australian CPIs also on tap.