Gold looks to have made a short term high and now looks headed back down. Let’s revise the daily and monthly charts.
GOLD DAILY CHART
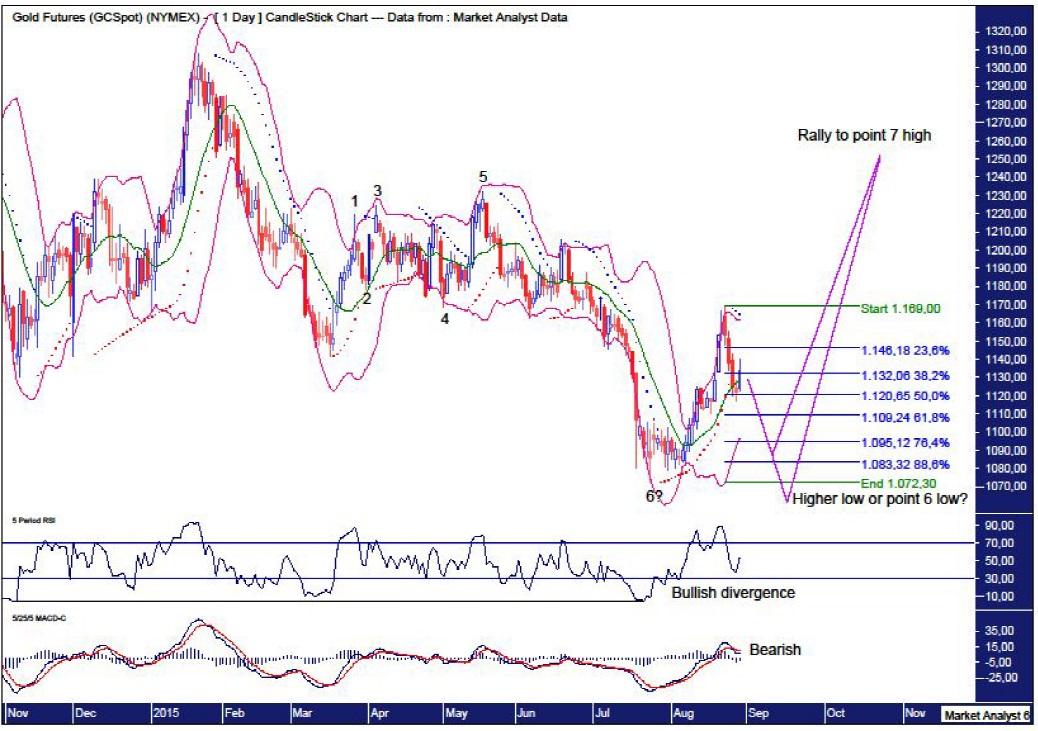
We can see the 7 point broadening top formation which we have been tracking for most of the year remains in play. The point 6 low looks in place or will be shortly and then the final parabolic rally into a point 7 high should occur. The fact that the point 6 low has made new yearly lows leads me to believe the point 7 high will be much higher than previously anticipated.
The recent low at $1072 did set up a bullish divergence using a longer time frame. One last low now would likely set up a triple bullish divergence which generally leads to a significant price rise.
The MACD indicator now looks to generally be trending up although it currently has a bearish bias indicating lower prices are likely over the near term.
The PSAR indicator shows price has just busted the dots on the downside so a bearish bias is now in force.
The Bollinger Bands show price is back at the middle band which looks to be providing some support. I expect this to be temporary only as price puts in a higher low back down around the lower band.
The first correction in a new bull trend often makes a deep retracement and I am favouring price to put in the first higher low down around the 76.4% level at $1095 and perhaps a touch lower although probably not as low as the 88.6% level at $1083.
It is also not out of the question for one final low to be seen. This scenario is given credence by the fact that the recent rally did not break any previous swing high levels.
We will need to see how price behaves down below $1100 to gives us a better idea of which scenario is occurring.
Once that low is in place I expect the belated bear rally to finally kick off.
GOLD MONTHLY CHART
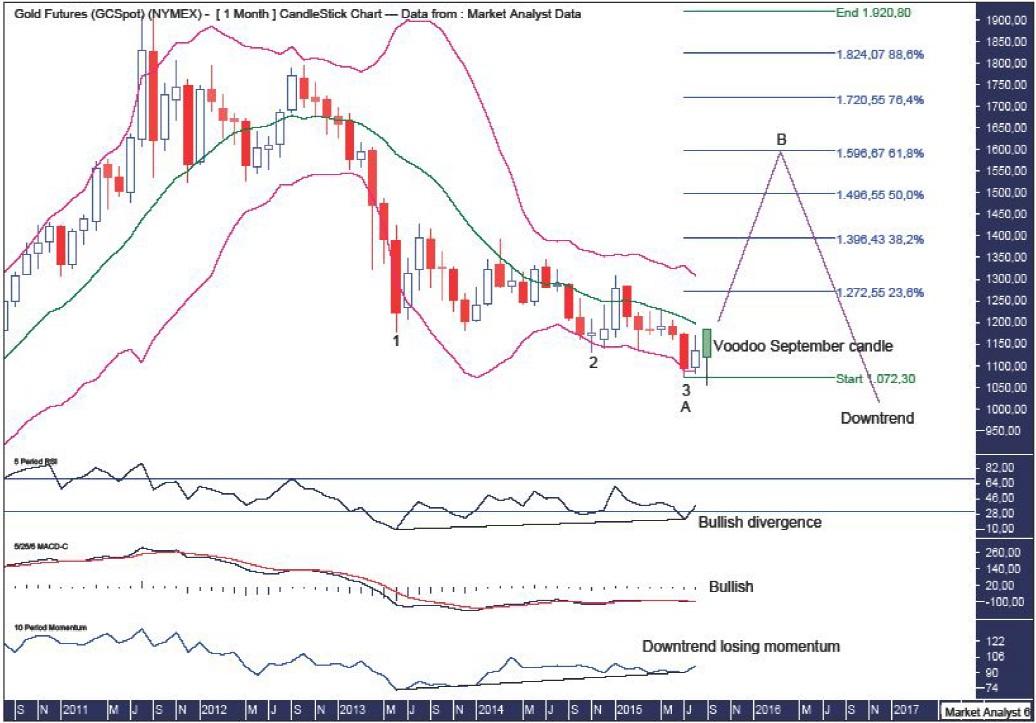
We can see the recent low set up a “three strikes and you’re out” low formation.
The recent low set up a bullish divergence on the RSI. The MACD indicator shows a triple bullish divergence and now a bullish bias again.
The Momentum indicator shows the downtrend began losing momentum at the first strike low.
The Bollinger Bands show the recent low at support from the lower band. If one final low is still to be seen then it would likely trade well below the lower band before reversing straight back up.
If the low is in place and a higher low plays out then the low in August at $1080 should hold although price may correct to the August open price which stands at $1095. Breaking the August low would surely mean price is headed to one final low.
If price does trade to new lows in September then I would expect it to be a spike low before sharp reversal back up that shows a bullish outside reversal candle with a big wick on the downside for the month of September. This remains a clear possibility and I have drawn Voodoo style how the September candle should look if price does trade to one final low.
Looking at this chart, price has virtually done bugger all since the first strike low in June 2013. These periods are very frustrating and can be difficult to trade as the overall downtrend inches down.
However, I expect this “boring” period is now at an end and some exciting action is finally about to be seen in the form of a spectacular B wave bear rally. Wave B rallies are often very big and get the crowd thinking the bull trend is off and running again.
I have added Fibonacci retracement levels of the move down from all time high to recent low. It will be interesting to watch how price trades around each level. Once potential level to end the bear rally is the 61.8% level which stands at $1596. All I expect is the rally to be a big one and how price behaves will give us better idea of where the final rally high will ultimately occur.
The long term view, outlined in previous analysis, remains unchanged which calls for a substantial rally before the final move down below $600 in the years to come. This would be the wave C low.
Bio
Austin Galt is The Voodoo Analyst. I have studied charts for over 20 years and am currently a private trader. Several years ago I worked as a licensed advisor with a well known Australian stock broker. While there was an abundance of fundamental analysts, there seemed to be a dearth of technical analysts. My aim here is to provide my view of technical analysis that is both intriguing and misunderstood by many. I like to refer to it as the black magic of stock market analysis.
The above is a matter of opinion provided for general information purposes only and is not intended as investment advice. Information and analysis above are derived from sources and utilising methods believed to be reliable, but we cannot accept responsibility for any losses you may incur as a result of this analysis. Individuals should consult with their personal financial advisors. Put simply, it is JUST MY OPINION.
Recommended Content
Editors’ Picks
AUD/USD stands firm above 0.6500 with markets bracing for Aussie PPI, US inflation

The Aussie Dollar begins Friday’s Asian session on the right foot against the Greenback after posting gains of 0.33% on Thursday. The AUD/USD advance was sponsored by a United States report showing the economy is growing below estimates while inflation picked up. The pair traded at 0.6518.
EUR/USD mired near 1.0730 after choppy Thursday market session

EUR/USD whipsawed somewhat on Thursday, and the pair is heading into Friday's early session near 1.0730 after a back-and-forth session and complicated US data that vexed rate cut hopes.
Gold soars as US economic woes and inflation fears grip investors

Gold prices advanced modestly during Thursday’s North American session, gaining more than 0.5% following the release of crucial economic data from the United States. GDP figures for the first quarter of 2024 missed estimates, increasing speculation that the US Fed could lower borrowing costs.
Ethereum could remain inside key range as Consensys sues SEC over ETH security status

Ethereum appears to have returned to its consolidating move on Thursday, canceling rally expectations. This comes after Consensys filed a lawsuit against the US SEC and insider sources informing Reuters of the unlikelihood of a spot ETH ETF approval in May.
Bank of Japan expected to keep interest rates on hold after landmark hike

The Bank of Japan is set to leave its short-term rate target unchanged in the range between 0% and 0.1% on Friday, following the conclusion of its two-day monetary policy review meeting for April. The BoJ will announce its decision on Friday at around 3:00 GMT.

