EUR/USD, that had already confirmed the FibStalker’s “W-support pattern” on the daily after Thursday, shows again participation from longs today at the 1.3790 support area.
This area had been tested already once and confirmed. However, anything can happen in the markets and I wanted to see a new confirmation of price on top of this level. I am glad this confirmation came today and I showed it on-line during my FXStreet webinar.
Before I drill into the 4-hour chart, give a peek at the daily chart below:
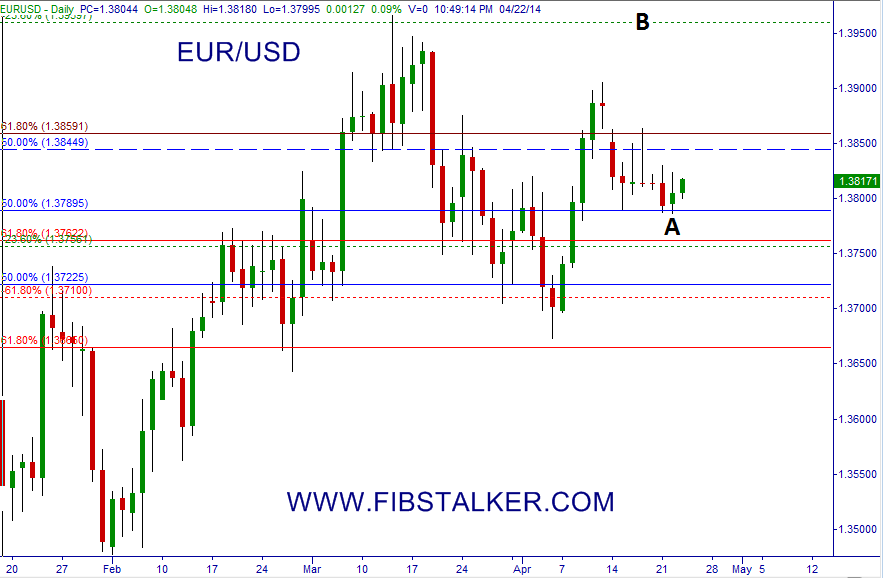
"EUR/USD holds support at 1.3790" – April 22th 2014
we can clearly see that the support area A is holding price and the 1st target of the corresponding measured move has targets at previous highs, in the B area. We also see the other group of participants which is preparing to short in the area starting at 1.3845. I do not believe these sellers will have success (but my Mr. Market is not interested in my beliefs, and remember that anything can happen) and this would be confirmed is price just climbed above the 1.3860 level.
When we drill down into the 4-hour chart, a couple of very good and useful observations can be made:
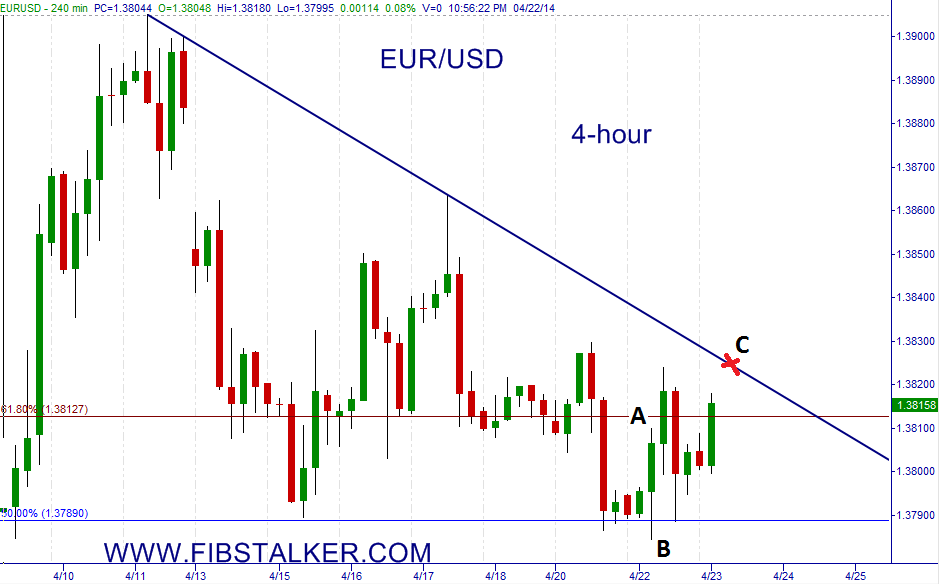
"EURUSD confirmed already support on the 4-hour chart" – April 22nd 2014
The Euro has re-confirmed support yesterday morning when price went for the first time above A. The potential action and trading plan would have been to buy a breakout from A with a stop below B (this is not mentioned here after the fact, but a requirement of the FibStalking technique and you can review my previous analysis/videos). When you think of getting involved in the markets, please always mind risk. Notice that very few people would be able to stick to this trade after seeing that long throw-back red bar, just after A was pierced on the upside.
But this is the whole point of “doing things differently”! If you have a trading plan and your risk level is decent (not 5%, but rather 0.5% on each trade, and you can be a superstar!) you can easily stick to the plan and I believe that trader who want to become consistent must learn to do it.
Most people will still be waiting for price to break above the “C” trendline. When/if that happens those who entered in A will have the opportunity to transform their risk into a risk-free trade, while the late comers trading the breakout in C will take all the risks of having price approaching the potential area of resistance at 1.3845-1.3860. In my opinion, trading the breakout at C is inherently wrong and does not align with the current assessment of price structure and requires taking unnecessary risks.
Moreover the trendline really does not have any real market meaning, but just a line that we believe “may” explain prices. The fact that it is watched by lots of retail traders or even more experienced traders does not make it more valid, especially in modern markets that are governed by computerized algorithmics.
On top of that, price dynamics has already provided all the information we need! By breaking above the A level, price behavior in the Euro offered an important piece of information, showing that professional traders and program trading are still willing to support higher prices in this pair. Moreover entering in A offers the possibility for a 1R (unit of risk) in gains before price gets to the next dangerous resistance area (where price can always reverse), so that you can lock half in and raise your stop in the hope of bringing the trade right into that 1.4080 target.
Recommended Content
Editors’ Picks
EUR/USD clings to daily gains above 1.0650

EUR/USD gained traction and turned positive on the day above 1.0650. The improvement seen in risk mood following the earlier flight to safety weighs on the US Dollar ahead of the weekend and helps the pair push higher.
GBP/USD recovers toward 1.2450 after UK Retail Sales data

GBP/USD reversed its direction and advanced to the 1.2450 area after touching a fresh multi-month low below 1.2400 in the Asian session. The positive shift seen in risk mood on easing fears over a deepening Iran-Israel conflict supports the pair.
Gold holds steady at around $2,380 following earlier spike

Gold stabilized near $2,380 after spiking above $2,400 with the immediate reaction to reports of Israel striking Iran. Meanwhile, the pullback seen in the US Treasury bond yields helps XAU/USD hold its ground.
Bitcoin Weekly Forecast: BTC post-halving rally could be partially priced in Premium

Bitcoin price shows no signs of directional bias while it holds above $60,000. The fourth BTC halving is partially priced in, according to Deutsche Bank’s research.
Week ahead – US GDP and BoJ decision on top of next week’s agenda

US GDP, core PCE and PMIs the next tests for the Dollar. Investors await BoJ for guidance about next rate hike. EU and UK PMIs, as well as Australian CPIs also on tap.